Unlock a world of possibilities! Login now and discover the exclusive benefits awaiting you.
- Qlik Community
- :
- Forums
- :
- Analytics & AI
- :
- Products & Topics
- :
- App Development
- :
- Getting limited data set warning in line chart
- Subscribe to RSS Feed
- Mark Topic as New
- Mark Topic as Read
- Float this Topic for Current User
- Bookmark
- Subscribe
- Mute
- Printer Friendly Page
- Mark as New
- Bookmark
- Subscribe
- Mute
- Subscribe to RSS Feed
- Permalink
- Report Inappropriate Content
Getting limited data set warning in line chart
According to Qlik documentation, line chart will show a "Currently showing a limited data set" message when a chart contains around 10,000 data points (see "Display Limitations", https://help.qlik.com/en-US/sense-developer/February2021/Subsystems/Mashups/Content/Sense_Mashups/Cr...)
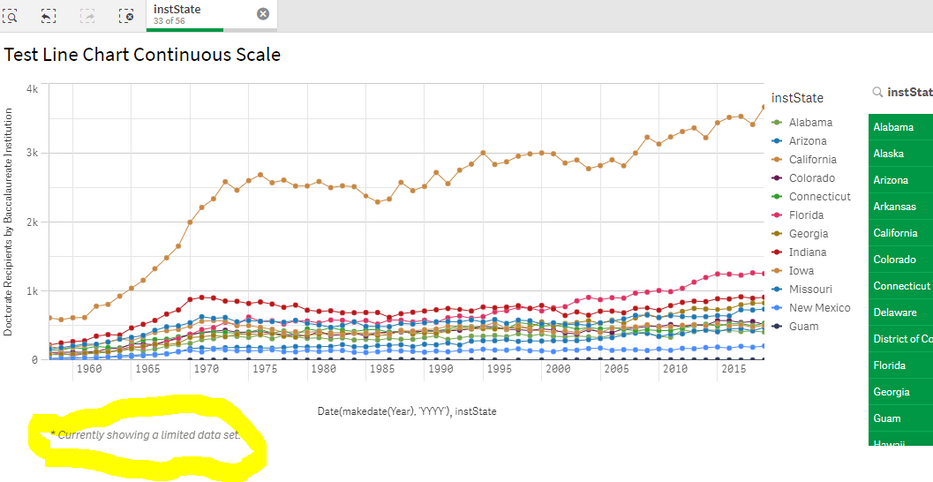
I am trying to understand why my chart is showing the limited data message when I have a line chart defined with continuous scale and with an X axis of 33 states grouped by 32 years, which comes to 1,056 data points. Why am I getting the limited data since the chart's data points are far less than the 10,000 limit?
As you can see in the chart below, once I select the 33rd state, I get the limited data message,
Thanks
Brian
Accepted Solutions
- Mark as New
- Bookmark
- Subscribe
- Mute
- Subscribe to RSS Feed
- Permalink
- Report Inappropriate Content
Hi @Digvijay_Singh,
Thank you for your QVF.
Yes, I agreed this behavior may change when you use continuous-scale vs non-continuous-scale
Open the same app "testApp.qvf" in the hub (not mashup as mentioned in your link ). The observations are identical except the number of data points
- if you select up to 33 state, "Currently showing a limited data set" is displayed
- however, if you switch to edit mode and uncheck "use continuous-scale" in appearance >> X-axis, this message will desappear. You need to select more to make it appears again
For line chart limitation see https://help.qlik.com/en-US/sense/February2022/Subsystems/Hub/Content/Sense_Hub/Visualizations/LineC... this link provide the clear behavior when continuous-scale or non-continuous-scale is used.
/joseph
- Mark as New
- Bookmark
- Subscribe
- Mute
- Subscribe to RSS Feed
- Permalink
- Report Inappropriate Content
Hi @briwilli,
Thank you for posting your question.
For further investigation, can you share your QVF? The sample must be as simplified as possible to isolate and clearly show the issue
Regards,
Qlik Support
- Mark as New
- Bookmark
- Subscribe
- Mute
- Subscribe to RSS Feed
- Permalink
- Report Inappropriate Content
Attached is the requested QVF file. As you can see, on initial display of the chart, the limited data set message is displayed. If you then apply a filter by selecting 32 or less states, then the message goes away, but once you add the 33rd state to the filter the message re-appears. By my calculations there are 62 years and 33 states which comes out to 2,046 data points (I realize in my original post I incorrectly wrote 1,056 dps) which is less than the 10,000 data point limit.
Thanks
Brian
- Mark as New
- Bookmark
- Subscribe
- Mute
- Subscribe to RSS Feed
- Permalink
- Report Inappropriate Content
Probably its because the date dimension drills down further when we are in continuous scale as shown in the image. But I am not sure how the limit 10k is calculated.
- Mark as New
- Bookmark
- Subscribe
- Mute
- Subscribe to RSS Feed
- Permalink
- Report Inappropriate Content
Hi @Digvijay_Singh,
Thank you for your QVF.
Yes, I agreed this behavior may change when you use continuous-scale vs non-continuous-scale
Open the same app "testApp.qvf" in the hub (not mashup as mentioned in your link ). The observations are identical except the number of data points
- if you select up to 33 state, "Currently showing a limited data set" is displayed
- however, if you switch to edit mode and uncheck "use continuous-scale" in appearance >> X-axis, this message will desappear. You need to select more to make it appears again
For line chart limitation see https://help.qlik.com/en-US/sense/February2022/Subsystems/Hub/Content/Sense_Hub/Visualizations/LineC... this link provide the clear behavior when continuous-scale or non-continuous-scale is used.
/joseph
- Mark as New
- Bookmark
- Subscribe
- Mute
- Subscribe to RSS Feed
- Permalink
- Report Inappropriate Content
Great, thank you for your response. The link you provided has the information on limitations that I was seeking.
Thanks again,
Brian


