Unlock a world of possibilities! Login now and discover the exclusive benefits awaiting you.
- Qlik Community
- :
- Forums
- :
- Analytics & AI
- :
- Products & Topics
- :
- App Development
- :
- Group time values
- Subscribe to RSS Feed
- Mark Topic as New
- Mark Topic as Read
- Float this Topic for Current User
- Bookmark
- Subscribe
- Mute
- Printer Friendly Page
- Mark as New
- Bookmark
- Subscribe
- Mute
- Subscribe to RSS Feed
- Permalink
- Report Inappropriate Content
Group time values
Hello,
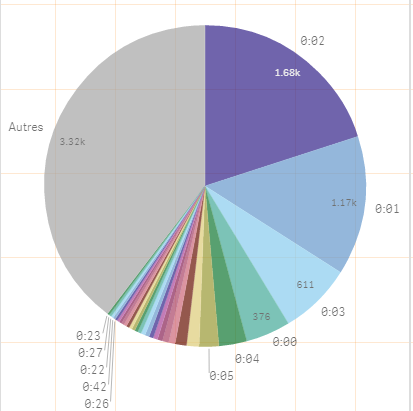
I would like to make a pie chart where i have resolution times, but due to too many different values i need to group them. this pie chart display ticket open times this mean i will need groups like following :
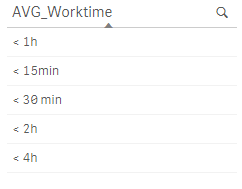
1st group : 1 min to 15 min
2nd group: 16 min to 30 min
3rd group: 30 min to 1 h
4th group: 1 h to 2 h
5th group: 3h to 4h
etc
a solution where i group by half hours is less suited , but can also help.
Sometimes some ticket don't have a time at all , then the value is 00:00
do you have any clue how to achieve that ? thank you in advance.
Accepted Solutions
- Mark as New
- Bookmark
- Subscribe
- Mute
- Subscribe to RSS Feed
- Permalink
- Report Inappropriate Content
morning,
Example Data Load:
Time_with_Group:
LOAD
*,
'Group' & IF(ThisTime >= MakeTime(1,0,0),Hour(ThisTime) + 3,
IF(ThisTime > MakeTime(0,0,0) AND ThisTime <=MakeTime(0,15,0), 1,
IF(ThisTime > MakeTime(0,15,0) AND ThisTime <=MakeTime(0,30,0), 2,
IF(ThisTime > MakeTime(0,30,0) AND ThisTime <=MakeTime(1,0,0), 3,
'No Ticket')))) AS Shift_Group;
SQL SELECT
TicketTime AS ThisTime,
TicketID,
OtherTicketFields
FROM Ticket_Table;
Then you can add Shift_Group as a Pie chart Dimension, with a count of TicketID (for example)
A filter pane with Shift_Group as a Dimension, will let you filter again (although you can do it by clicking segments of the Pie Chart as well)
- Mark as New
- Bookmark
- Subscribe
- Mute
- Subscribe to RSS Feed
- Permalink
- Report Inappropriate Content
you could look at a nested IF statement:
'Group' & IF([YourTime] > MakeTime(1,0,0),Hour([YourTime]) + 3,
IF([YourTime] > MakeTime(0,0,0) AND [YourTime] <=MakeTime(0,15,0), 1,
IF([YourTime] > MakeTime(0,15,0) AND [YourTime] <=MakeTime(0,30,0), 2,
IF([YourTime] > MakeTime(0,30,0) AND [YourTime] <=MakeTime(1,0,0), 3,
' - No Ticket')
- Mark as New
- Bookmark
- Subscribe
- Mute
- Subscribe to RSS Feed
- Permalink
- Report Inappropriate Content
Thank You Andrew,
i tried it , but it didn't gave any result, i' have to work on the way i get my data, i will come back on this topic in couple days
- Mark as New
- Bookmark
- Subscribe
- Mute
- Subscribe to RSS Feed
- Permalink
- Report Inappropriate Content
morning,
I used:
TempTime:
LOAD
ThisTime,
'Group' & IF(ThisTime >= MakeTime(1,0,0),Hour(ThisTime) + 3,
IF(ThisTime > MakeTime(0,0,0) AND ThisTime <=MakeTime(0,15,0), 1,
IF(ThisTime > MakeTime(0,15,0) AND ThisTime <=MakeTime(0,30,0), 2,
IF(ThisTime > MakeTime(0,30,0) AND ThisTime <=MakeTime(1,0,0), 3,
'No Ticket')))) AS Shift_Group;
LOAD
MakeTime(FLOOR(RecNo()/6),CEIL(RAND()*50),0) AS ThisTime
AutoGenerate 24;
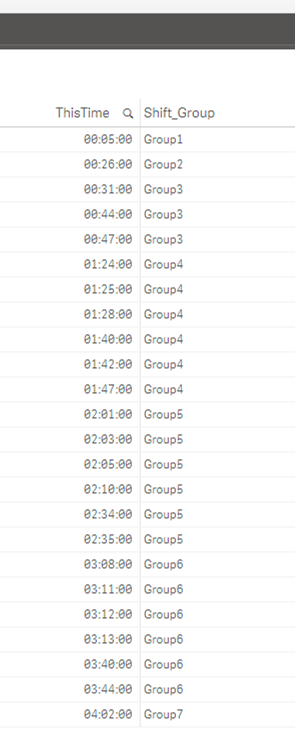
and it returned results:
- Mark as New
- Bookmark
- Subscribe
- Mute
- Subscribe to RSS Feed
- Permalink
- Report Inappropriate Content
Hello Andrew,
I tried again, if i display it on a table i have the correct anser , but if i select the differents groups it break the link with the rest of the displayded infromations, also i have to show it on a pie chart , so i need a count, per example 120 call closed under 15 min, 83 under 30, etc.
Do you have an idea how to add a count to the conditions and make so that if i select a group it filter also the information on the display ??
Thank you one more time for this helpfull first part
- Mark as New
- Bookmark
- Subscribe
- Mute
- Subscribe to RSS Feed
- Permalink
- Report Inappropriate Content
morning,
Example Data Load:
Time_with_Group:
LOAD
*,
'Group' & IF(ThisTime >= MakeTime(1,0,0),Hour(ThisTime) + 3,
IF(ThisTime > MakeTime(0,0,0) AND ThisTime <=MakeTime(0,15,0), 1,
IF(ThisTime > MakeTime(0,15,0) AND ThisTime <=MakeTime(0,30,0), 2,
IF(ThisTime > MakeTime(0,30,0) AND ThisTime <=MakeTime(1,0,0), 3,
'No Ticket')))) AS Shift_Group;
SQL SELECT
TicketTime AS ThisTime,
TicketID,
OtherTicketFields
FROM Ticket_Table;
Then you can add Shift_Group as a Pie chart Dimension, with a count of TicketID (for example)
A filter pane with Shift_Group as a Dimension, will let you filter again (although you can do it by clicking segments of the Pie Chart as well)
- Mark as New
- Bookmark
- Subscribe
- Mute
- Subscribe to RSS Feed
- Permalink
- Report Inappropriate Content
Thank you Andrew , this was the last piece i needed