Unlock a world of possibilities! Login now and discover the exclusive benefits awaiting you.

Announcements
Share your agentic AI experience, learn from others, and earn a new badge: Put Agentic AI to Work
- Qlik Community
- :
- Forums
- :
- Analytics & AI
- :
- Products & Topics
- :
- App Development
- :
- Grouping elements in pareto chart
Options
- Subscribe to RSS Feed
- Mark Topic as New
- Mark Topic as Read
- Float this Topic for Current User
- Bookmark
- Subscribe
- Mute
- Printer Friendly Page
Turn on suggestions
Auto-suggest helps you quickly narrow down your search results by suggesting possible matches as you type.
Showing results for

Anonymous
Not applicable
2017-05-30
11:14 AM
- Mark as New
- Bookmark
- Subscribe
- Mute
- Subscribe to RSS Feed
- Permalink
- Report Inappropriate Content
Grouping elements in pareto chart
Hi,
I made the pareto chart bellow but I've got to much elements on the X axis.
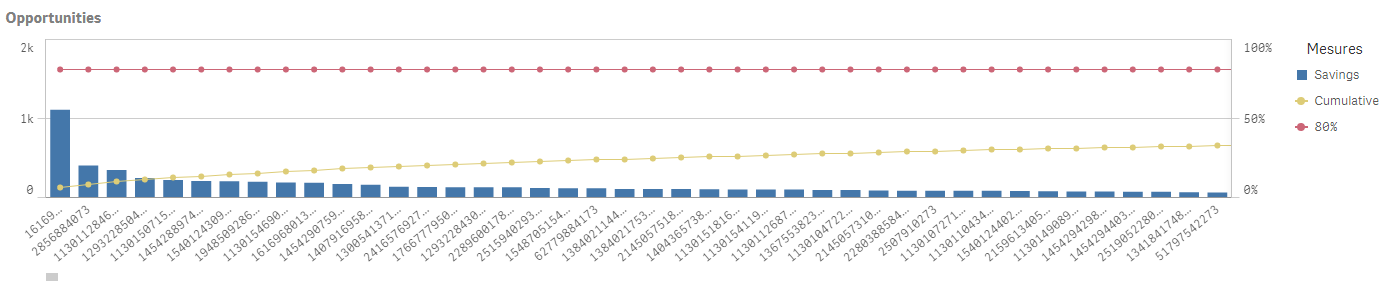
I would like to group these elements in function of the cumulative value like that:
- 0% - 20%
- 20% - 40%
- 40% - 60%
- 60% - 80%
- 80% - 100%
Then, I want to be able to select one group and to put on a table the selected elements.
Thanks in advance.
Charlie
701 Views
1 Reply
Anonymous
Not applicable
2017-06-02
09:44 AM
Author
- Mark as New
- Bookmark
- Subscribe
- Mute
- Subscribe to RSS Feed
- Permalink
- Report Inappropriate Content
Hi,
Nobody has any ideas to solve my problem or maybe this is not possible with Qlik Sense ?
Charlie
614 Views