Unlock a world of possibilities! Login now and discover the exclusive benefits awaiting you.

- Qlik Community
- :
- Forums
- :
- Analytics & AI
- :
- Products & Topics
- :
- App Development
- :
- Help with Bar Graph
- Subscribe to RSS Feed
- Mark Topic as New
- Mark Topic as Read
- Float this Topic for Current User
- Bookmark
- Subscribe
- Mute
- Printer Friendly Page

 MatthewShirey
- Mark as New
- Bookmark
- Subscribe
- Mute
- Subscribe to RSS Feed
- Permalink
- Report Inappropriate Content
Help with Bar Graph
Hello community,
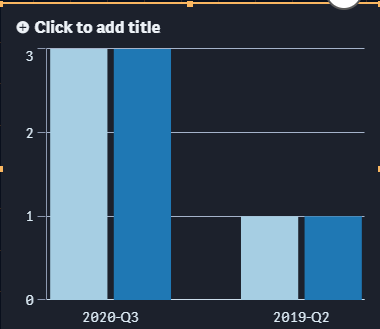
I have a problem I cant seem to figure out in an app I am developing. I am trying to create a bar graph with two bars. The x axis is the date, and the two bars are both requestor and donor. So for instance, when I would filter down to just see Matt as a name, I would see two bars on 4/1/2021, one for requestor and one for donor side by side. When I go to develop this in qlik it only allows me to display Requestor. Even when I use this equation : Count({<[Opened Date]={">=$(=date(addmonths(max([Opened Date])),'M/D/YYYY'))"}>} [Donor Name]) it still displays requestor name. Does anyone know a workaround for this? Thank you in advance. below is a screenshot of the issue I am having.
| Date | Requestor Name | Donor Name |
| 4/1/2021 | Matt | Steve |
| 4/1/2021 | Sam | Matt |
| 4/1/2021 | Steve | Tom |
| 4/1/2021 | Tom | Sam |
 mato32188
- Mark as New
- Bookmark
- Subscribe
- Mute
- Subscribe to RSS Feed
- Permalink
- Report Inappropriate Content
Hi @MatthewShirey ,
what you need to do is to create separate table with linked field to both of existing fields (Requestor and Donor).
core_table:
load
Date,
Requestor&'-'&Donor as NameLinkKey,
Requestor,
Donor,
Requestor&';'&Donor as JoinedNames
Inline [
Date,Requestor,Donor
04/01/2021,Matt,Steve
04/01/2021,Sam,Matt
04/01/2021,Steve,Tom
04/01/2021,Tom,Sam
];
names:
load
NameLinkKey,
SubField(JoinedNames,';') as Name
Resident tmp;
drop fields JoinedNames;
Then use field Name as a filter.
BR
m
