Unlock a world of possibilities! Login now and discover the exclusive benefits awaiting you.
- Qlik Community
- :
- Forums
- :
- Analytics & AI
- :
- Products & Topics
- :
- App Development
- :
- Historical data into Qlik Sense
- Subscribe to RSS Feed
- Mark Topic as New
- Mark Topic as Read
- Float this Topic for Current User
- Bookmark
- Subscribe
- Mute
- Printer Friendly Page
- Mark as New
- Bookmark
- Subscribe
- Mute
- Subscribe to RSS Feed
- Permalink
- Report Inappropriate Content
Historical data into Qlik Sense
Hello,
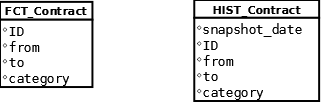
I would like to include historical data into my Qlik Sense application. As an example there is my FCT_Contract table, containing every data about a contract and my HIST_Contract table containing the data by month.
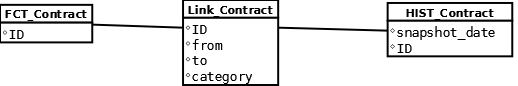
How can I manage the two sets of data to work within one Qlik Sense application ? I would want to make some comparation vizualisation (between periods) and to have my "classic" vizualisation about my current period also. I could make a link table to avoid the duplication of every dimensions like this :
Do I have to duplicate every measure I have in my application ? Lets say I would like to have the count of contract by category. If I have only one measure "Contract count" (which is filtered by period), I could have this count right only if I have selected one period (current or only one month). If after I select multiple period to be able to make comparaison between multiple periods, my other vizualisation which work on one period would be false. I want to avoid this kind of confusion.
Do you have a "best practice" to work with historical data with snapshot date ?
Thanks
- Mark as New
- Bookmark
- Subscribe
- Mute
- Subscribe to RSS Feed
- Permalink
- Report Inappropriate Content
See this document (which applies to Qlik Sense too): IntervalMatch and Slowly Changing Dimensions
talk is cheap, supply exceeds demand
- Mark as New
- Bookmark
- Subscribe
- Mute
- Subscribe to RSS Feed
- Permalink
- Report Inappropriate Content
Thanks for the fast answer.
I read the document but I don't see how this is applicable to my problem. I don't want to select data for its validity within an interval (as the department for a sale person as in the document) but I want to compare data between different snapshot dates and keep the same measures & dimensions but only add some filters or something to help me clarify the situation for my users. I want to be able to work with the "current version" of my data and the "old versions" in the same application/sheet.
- Mark as New
- Bookmark
- Subscribe
- Mute
- Subscribe to RSS Feed
- Permalink
- Report Inappropriate Content
If your two fact tables contain basically the same information, but at different granularity (i.e today versus historical months) then perhaps this blog post is more to the point: Fact Table with Mixed Granularity. The result will be one fact table and you can compare snapshots easily using a combination of set analysis, alternate states and/or bookmarks.
talk is cheap, supply exceeds demand