Unlock a world of possibilities! Login now and discover the exclusive benefits awaiting you.
- Qlik Community
- :
- Forums
- :
- Analytics & AI
- :
- Products & Topics
- :
- App Development
- :
- How do i set style for data piont using Qlik Sense...
- Subscribe to RSS Feed
- Mark Topic as New
- Mark Topic as Read
- Float this Topic for Current User
- Bookmark
- Subscribe
- Mute
- Printer Friendly Page
- Mark as New
- Bookmark
- Subscribe
- Mute
- Subscribe to RSS Feed
- Permalink
- Report Inappropriate Content
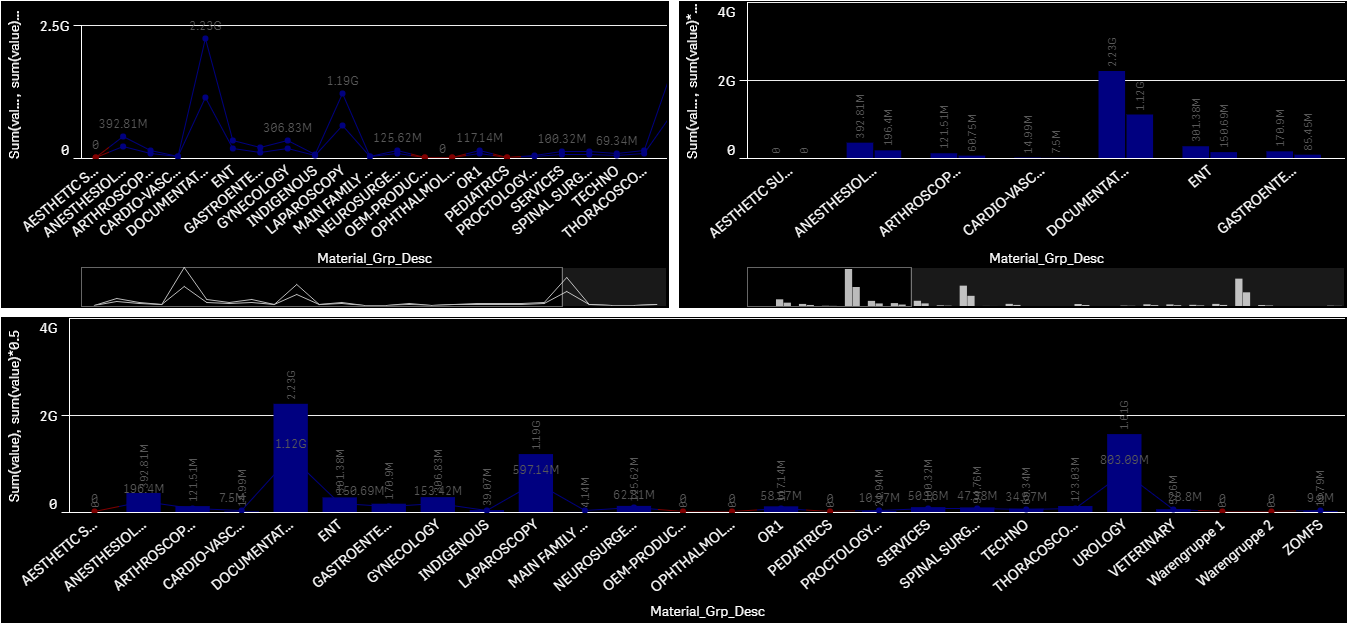
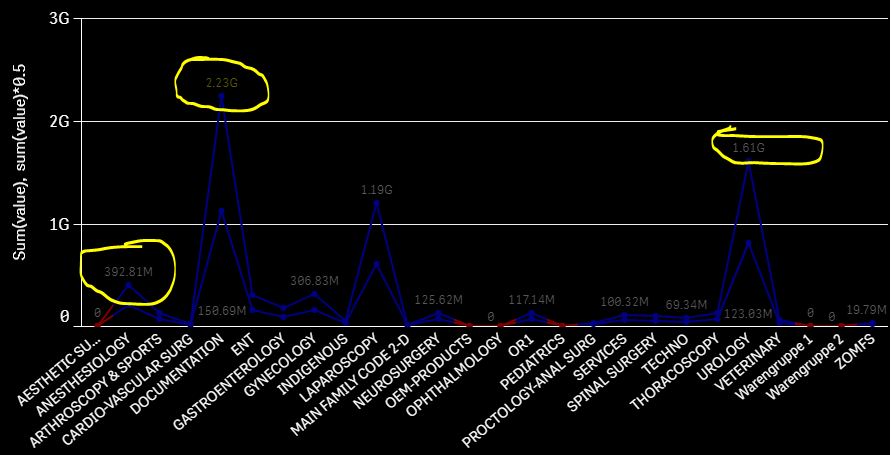
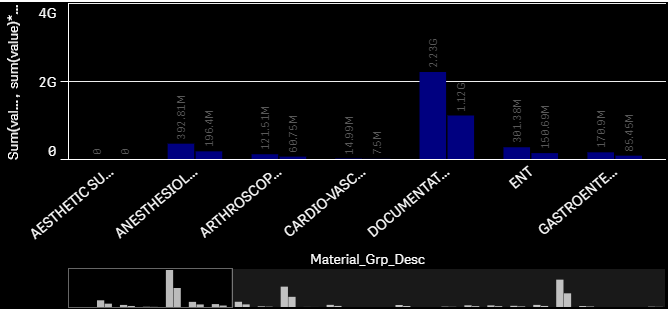
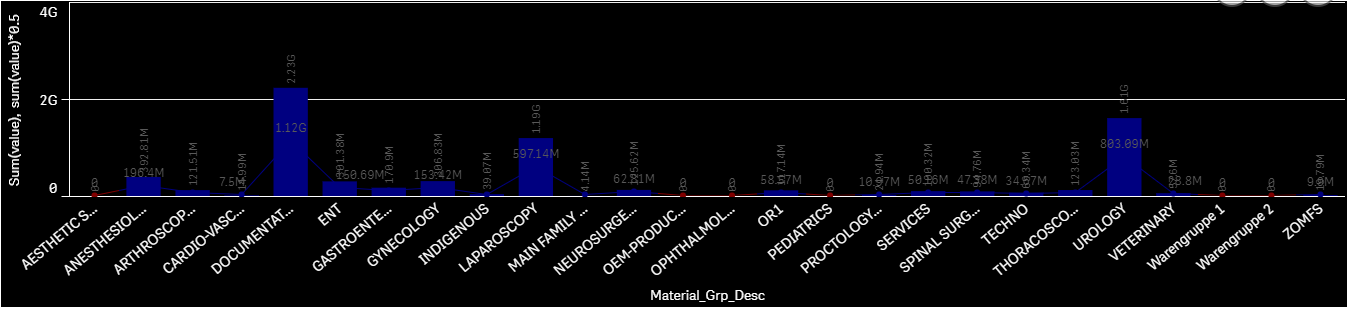
How do i set style for data piont using Qlik Sense Theme API?
Accepted Solutions
- Mark as New
- Bookmark
- Subscribe
- Mute
- Subscribe to RSS Feed
- Permalink
- Report Inappropriate Content
Hi,
The line chart:
"lineChart": {
"outOfRange": {
"color": "@Concrete"
},
"label": {
"value": {
"color": "@TextColor", ///this comes from the variables
"fontSize": "@TextSize"
}
}
},
The Bar:
"barChart": {
"label": {
"value": {
"color": "@TextColor",
"fontSize": "@TextSize"
}
},
"outOfRange": {
"color": "@TextColor"
}
},
Each chart needs a similar layout.
Ryan Arpe
- Mark as New
- Bookmark
- Subscribe
- Mute
- Subscribe to RSS Feed
- Permalink
- Report Inappropriate Content
Hi Ajay,
Have you figured out?
Thanks,
Venkat
- Mark as New
- Bookmark
- Subscribe
- Mute
- Subscribe to RSS Feed
- Permalink
- Report Inappropriate Content
- Mark as New
- Bookmark
- Subscribe
- Mute
- Subscribe to RSS Feed
- Permalink
- Report Inappropriate Content
Hi,
The line chart:
"lineChart": {
"outOfRange": {
"color": "@Concrete"
},
"label": {
"value": {
"color": "@TextColor", ///this comes from the variables
"fontSize": "@TextSize"
}
}
},
The Bar:
"barChart": {
"label": {
"value": {
"color": "@TextColor",
"fontSize": "@TextSize"
}
},
"outOfRange": {
"color": "@TextColor"
}
},
Each chart needs a similar layout.
Ryan Arpe