Unlock a world of possibilities! Login now and discover the exclusive benefits awaiting you.
- Qlik Community
- :
- Forums
- :
- Analytics & AI
- :
- Products & Topics
- :
- App Development
- :
- How to apply RangeSum in a Synthetic Dimension?
- Subscribe to RSS Feed
- Mark Topic as New
- Mark Topic as Read
- Float this Topic for Current User
- Bookmark
- Subscribe
- Mute
- Printer Friendly Page
- Mark as New
- Bookmark
- Subscribe
- Mute
- Subscribe to RSS Feed
- Permalink
- Report Inappropriate Content
How to apply RangeSum in a Synthetic Dimension?
What am I doing wrong?
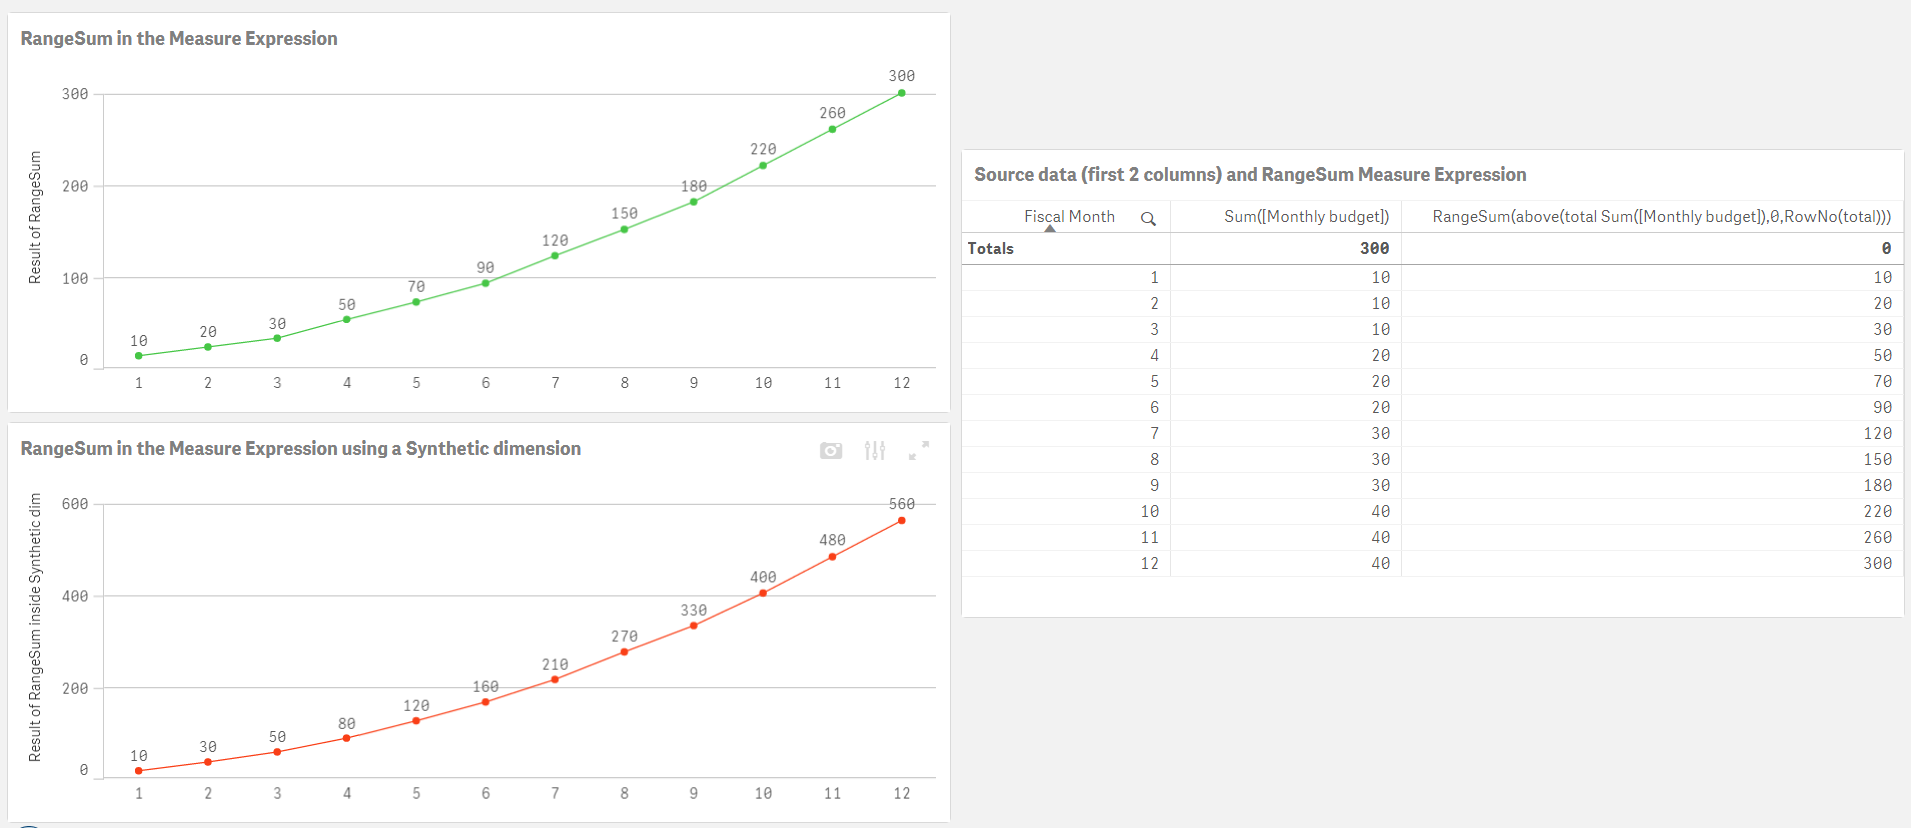
I am using RangeSum in a Synthetic Dimension but the result isn't the same as using RangeSum in a normal Measure Expression.
The Expression I am using in the Synthetic Dimension is:
If(ValueList('Measure Expression','Dummy')='Measure Expression', RangeSum(above(total Sum([Monthly budget]),0,RowNo(total))))
I would like to have the result as with the RangeSum in the normal Measure Expression:
RangeSum(above(total Sum([Monthly budget]),0,RowNo(total)))
- « Previous Replies
-
- 1
- 2
- Next Replies »
- Mark as New
- Bookmark
- Subscribe
- Mute
- Subscribe to RSS Feed
- Permalink
- Report Inappropriate Content
Here is an example on how Data Island can replace ValueList()
- Mark as New
- Bookmark
- Subscribe
- Mute
- Subscribe to RSS Feed
- Permalink
- Report Inappropriate Content
Dear Sunny,
Thanks very much for your support.
I would like to insert the qvf file of the app that I have used in the original question of this discussion so you "can show how it can be done with" my data, but I can't see how I can insert the qvf file. It seems only Pictures, Movies and Links can be inserted. 
Best regards,
Pim
- Mark as New
- Bookmark
- Subscribe
- Mute
- Subscribe to RSS Feed
- Permalink
- Report Inappropriate Content
Check here
- Mark as New
- Bookmark
- Subscribe
- Mute
- Subscribe to RSS Feed
- Permalink
- Report Inappropriate Content
Hello Sunny,
I still couldn’t find the “Use advanced editor” option so I am responding ‘directly on the post’ in this way.
I have attached the qvf file that I used for my original question.
Best regards / Met vriendelijke groet,
Pim Dorresteijn
Yokogawa Europe B.V. is registered in the commercial register of the chamber of commerce under file number 31024364.
DISCLAIMER
The content of this email, including any attachments, is confidential and may be privileged. If you are not the intended recipient you are hereby notified that any disclosure, copying, distribution or taking any action in reliance on the contents of this information is strictly prohibited and you are kindly requested to notify the sender immediately and delete this message. Yokogawa is neither liable for the proper and complete transmission of the information contained in this communication nor for any delay in its receipt.
- Mark as New
- Bookmark
- Subscribe
- Mute
- Subscribe to RSS Feed
- Permalink
- Report Inappropriate Content
Script
LOAD
"Fiscal Month",
"Monthly budget"
FROM [lib://Data Sources/Synthetic Dimension with RangeSum.xlsx]
(ooxml, embedded labels, table is [Simple source data]);
Dim:
LOAD * Inline [
Dim
Measure Expression
Dummy
];
Chart Dimensions
Fiscal Month
Dim
Expression
Aggr(If(Dim = 'Measure Expression', RangeSum(Above(Sum([Monthly budget]), 0, RowNo()))), Dim, [Fiscal Month])
- Mark as New
- Bookmark
- Subscribe
- Mute
- Subscribe to RSS Feed
- Permalink
- Report Inappropriate Content
Dear Sunny,
Your solution indeed gives the desired result on this test/try out/development app.
However the line graph that I finally need shall have calendar dates with continuous scale as dimension
I now noticed that in this case there isn't an option to define a second dimension.
So in de end neither an synthetic dimension nor a data island can be used......
Thanks a lot for your support.
I appreciate it very much!
- Mark as New
- Bookmark
- Subscribe
- Mute
- Subscribe to RSS Feed
- Permalink
- Report Inappropriate Content
Would you be able to implement that in your sample file to show what you mean? You might be right, but I am just interested in seeing what you have.
Thanks,
Sunny
- « Previous Replies
-
- 1
- 2
- Next Replies »