Unlock a world of possibilities! Login now and discover the exclusive benefits awaiting you.
- Qlik Community
- :
- Forums
- :
- Analytics & AI
- :
- Products & Topics
- :
- App Development
- :
- How to bring colour 1 to the front of a line graph
- Subscribe to RSS Feed
- Mark Topic as New
- Mark Topic as Read
- Float this Topic for Current User
- Bookmark
- Subscribe
- Mute
- Printer Friendly Page
- Mark as New
- Bookmark
- Subscribe
- Mute
- Subscribe to RSS Feed
- Permalink
- Report Inappropriate Content
How to bring colour 1 to the front of a line graph
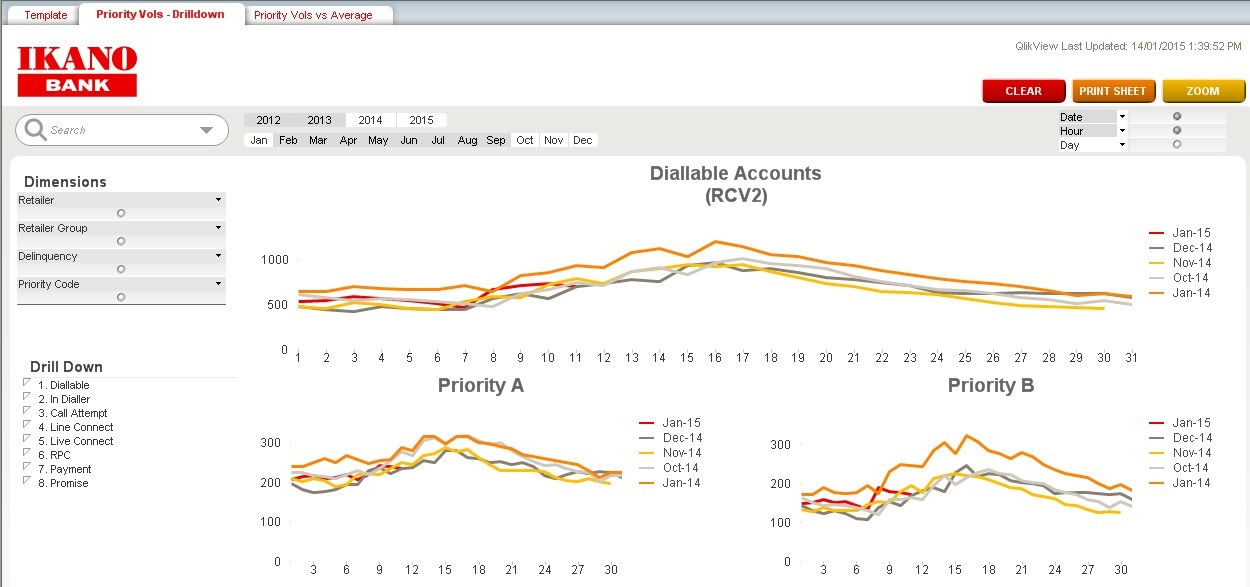
I have a line graph with colour 1 being red and this shows the latest month in a selection.
I need the latest selected month to always be red and the selectable months to be variable.
My selections currently get colour 1 as the lastest (which is great) BUT the graph displays colour one at the bottom.
How do I get colour one to be on the top?
I have tried using persistent colours but this does not do what I need.
- Mark as New
- Bookmark
- Subscribe
- Mute
- Subscribe to RSS Feed
- Permalink
- Report Inappropriate Content
Hi Nick,
if I get you correctly, you could just do what I do routinely: To get some standardization into my colours (and to use the CI_colours where possible), I have created a colour-palette of about 12 colours, stored their values in variables in a qvs_file which is loaded into every Dashboard as an INCLUDE and then use the expression_properties to govern the colour instead of the "colours" tab of the dialog. I think that way is more reliable and makes it easier (for others) to reconstruct which colour I have associated with each expression.
HTH
Best regards,
DataNibbler
- Mark as New
- Bookmark
- Subscribe
- Mute
- Subscribe to RSS Feed
- Permalink
- Report Inappropriate Content
Hey,
Can you attach the image of Application ?
Thanks
- Mark as New
- Bookmark
- Subscribe
- Mute
- Subscribe to RSS Feed
- Permalink
- Report Inappropriate Content
The screenshot of my graph is below. with the current selection Jan-15 is red and I need that on the top.
If I just select Dec-14, Nov-14, Oct-14 I would then need Dec-14 to be red and on the top.
Please be aware that I am very new to qlikview so there may be a simple resolution to this.
- Mark as New
- Bookmark
- Subscribe
- Mute
- Subscribe to RSS Feed
- Permalink
- Report Inappropriate Content
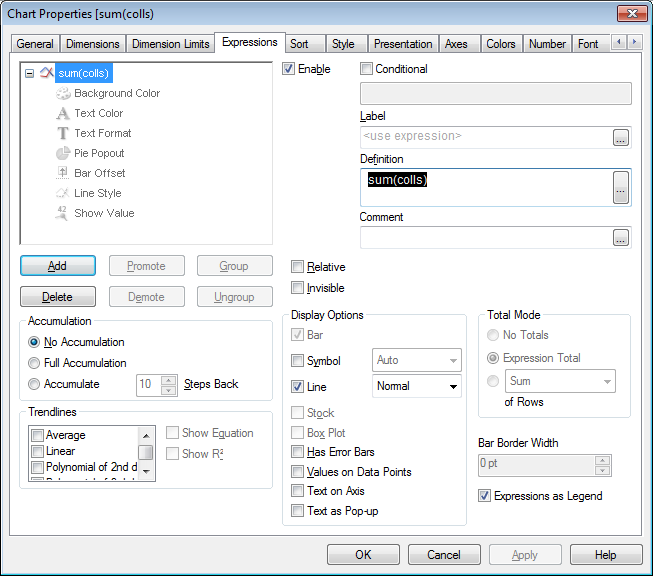
Thanks, I think I understand what you mean, I have set the colours (vColorRed, vColorGreen, etc)
How do I assign the colour in the expression rather than using the Colors tab?
- Mark as New
- Bookmark
- Subscribe
- Mute
- Subscribe to RSS Feed
- Permalink
- Report Inappropriate Content
Hi Nick,
well, if you have the "expression_properties" expanded like you have in your screenshot,
the node "Background color" is the one to use.
There you can enter your colour_variable which you have to define beforehand, sth. like
>>> SET v_color_black = rgb(0,0,0); <<<
=> Then you need to use the $() to signal to QlikView that it should evaluate the formula in the variable rather than just return it as a text, so you'll end up (in this example) with
>> = $(v_color_black) <<<
to enter in the edit_field.
HTH
Best regards,
DataNibbler
P.S.: In case you want to find the rgb_values of any colour you like, you can use a text_box - just colour it, using the radiobutton "static", then click on the colour -> you'll get a field of colours and, on the right, three boxes with the three values.