Unlock a world of possibilities! Login now and discover the exclusive benefits awaiting you.

- Qlik Community
- :
- Forums
- :
- Analytics & AI
- :
- Products & Topics
- :
- App Development
- :
- How to change axis title, but keep legend the same...
Options
- Subscribe to RSS Feed
- Mark Topic as New
- Mark Topic as Read
- Float this Topic for Current User
- Bookmark
- Subscribe
- Mute
- Printer Friendly Page
Turn on suggestions
Auto-suggest helps you quickly narrow down your search results by suggesting possible matches as you type.
Showing results for

Not applicable
2017-02-27
03:04 PM
- Mark as New
- Bookmark
- Subscribe
- Mute
- Subscribe to RSS Feed
- Permalink
- Report Inappropriate Content
How to change axis title, but keep legend the same?
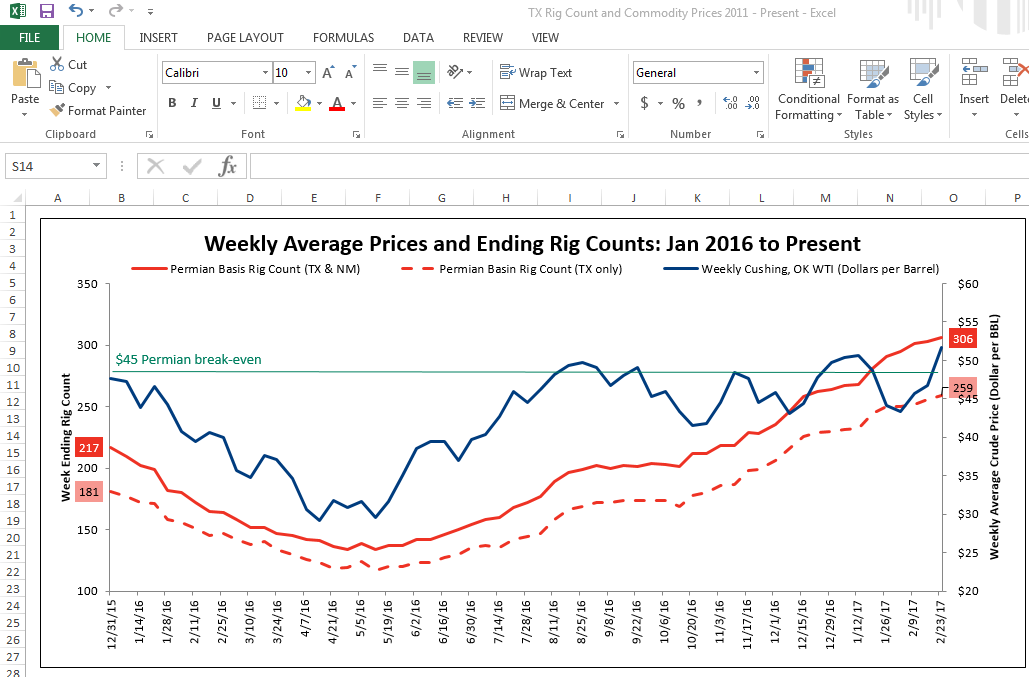
I'm in the process of recreating a previously done chart in Excel in Qliksense and having an issue changing the axis title while keeping the legend and labels of data the same. I've attached a picture of the Excel graph and Qlik graph. I need to change the Primary vertical axis to say 'Week Ending Rig Count" and the Secondary vertical axis to say "Weekly Average Crude Price (Dollar per BBL)". Is there a way to do this in Qlik? Thank you so much, any help is appreciated!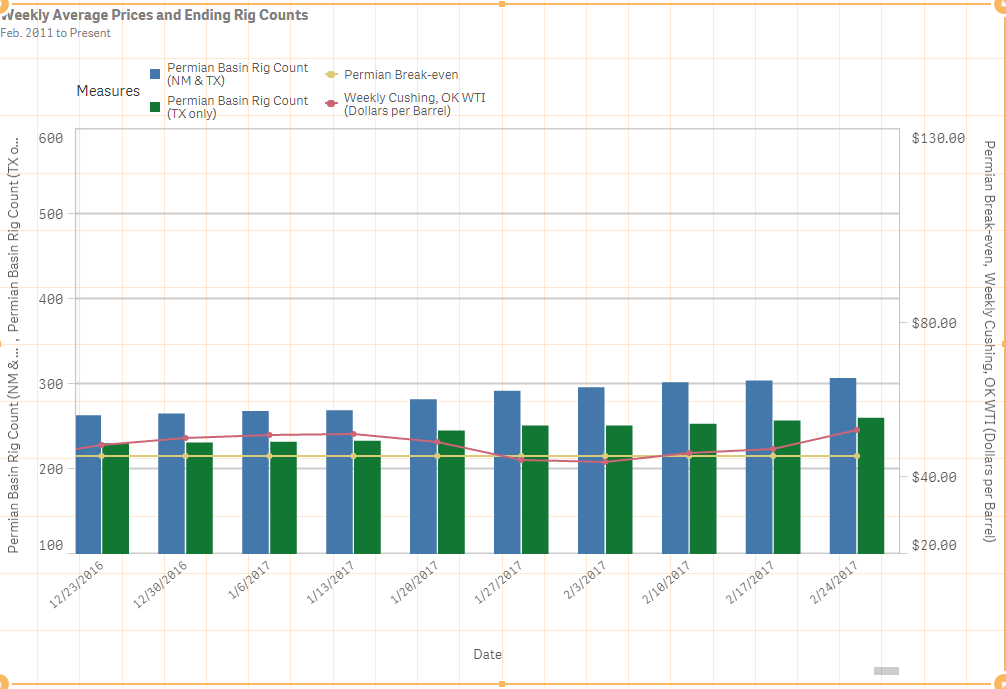
1,858 Views
1 Reply

 AyeVee
Contributor II
2021-04-21
09:55 AM
- Mark as New
- Bookmark
- Subscribe
- Mute
- Subscribe to RSS Feed
- Permalink
- Report Inappropriate Content
friends!
Is there any way to do above requirement in Qlik Sense? Thanks
Regards
AYE VEE
1,196 Views