Unlock a world of possibilities! Login now and discover the exclusive benefits awaiting you.
- Qlik Community
- :
- Forums
- :
- Analytics & AI
- :
- Products & Topics
- :
- App Development
- :
- Re: How to change the color within segments of pie...
- Subscribe to RSS Feed
- Mark Topic as New
- Mark Topic as Read
- Float this Topic for Current User
- Bookmark
- Subscribe
- Mute
- Printer Friendly Page
- Mark as New
- Bookmark
- Subscribe
- Mute
- Subscribe to RSS Feed
- Permalink
- Report Inappropriate Content
How to change the color within segments of pie chart
Hello,
I have pie charts on two different sheets with fields pass, fail, defect. I would like the colors to match up for both. Right now, they are different. I would like pass to be blue, fail to be red and defect to be yellow. Any way to customize the colors within the field/legend so they match?
Thanks!
- Mark as New
- Bookmark
- Subscribe
- Mute
- Subscribe to RSS Feed
- Permalink
- Report Inappropriate Content
Hello! You can use the option color by expression.
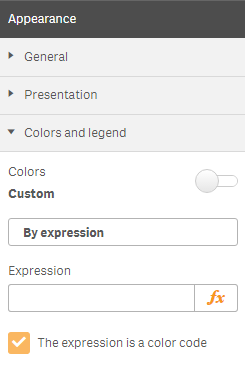
Let's say your dimension is called status. Then the expression would be:
if(status='pass', blue(), if(status='fail', red(), if(status='defect', yellow())))
Use this for both pie charts.
- Mark as New
- Bookmark
- Subscribe
- Mute
- Subscribe to RSS Feed
- Permalink
- Report Inappropriate Content
Hi, Following on from what Ivan said, you can use the IF statement and you can also use the Pick function to do a calculation for the colours
- Mark as New
- Bookmark
- Subscribe
- Mute
- Subscribe to RSS Feed
- Permalink
- Report Inappropriate Content
Very helpful! Thanks, Ivan!