Unlock a world of possibilities! Login now and discover the exclusive benefits awaiting you.
Announcements
Now accepting applications for the Qlik Luminary and Partner Ambassador Programs: Apply by July 6!
- Qlik Community
- :
- Forums
- :
- Analytics & AI
- :
- Products & Topics
- :
- App Development
- :
- How to create a reference line on a graph that hav...
Options
- Subscribe to RSS Feed
- Mark Topic as New
- Mark Topic as Read
- Float this Topic for Current User
- Bookmark
- Subscribe
- Mute
- Printer Friendly Page
Turn on suggestions
Auto-suggest helps you quickly narrow down your search results by suggesting possible matches as you type.
Showing results for
Not applicable
2015-08-13
04:21 PM
- Mark as New
- Bookmark
- Subscribe
- Mute
- Subscribe to RSS Feed
- Permalink
- Report Inappropriate Content
How to create a reference line on a graph that have a range as units on x-axis?
Dear all,
I have the graph below and I would to add a couple of reference to indicate thresholds of the normal distribution. As each bar represents a range, it has become challenging to define the condition for the reference.
Could you please provide some ideas on how to approach this?
Many thanks and hope to hear from you soon.
Kind regards,
Johanna
I have the graph below 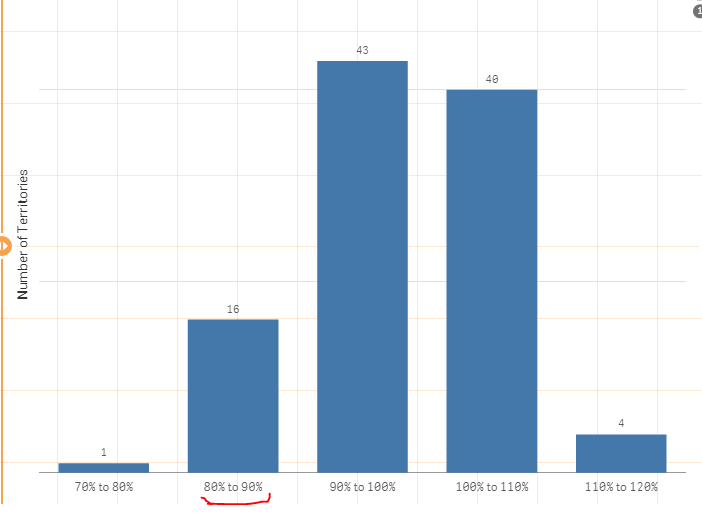
602 Views
0 Replies