Unlock a world of possibilities! Login now and discover the exclusive benefits awaiting you.
- Qlik Community
- :
- Forums
- :
- Analytics & AI
- :
- Products & Topics
- :
- App Development
- :
- How to display latest month only in qlik sense dim...
- Subscribe to RSS Feed
- Mark Topic as New
- Mark Topic as Read
- Float this Topic for Current User
- Bookmark
- Subscribe
- Mute
- Printer Friendly Page
- Mark as New
- Bookmark
- Subscribe
- Mute
- Subscribe to RSS Feed
- Permalink
- Report Inappropriate Content
How to display latest month only in qlik sense dimension
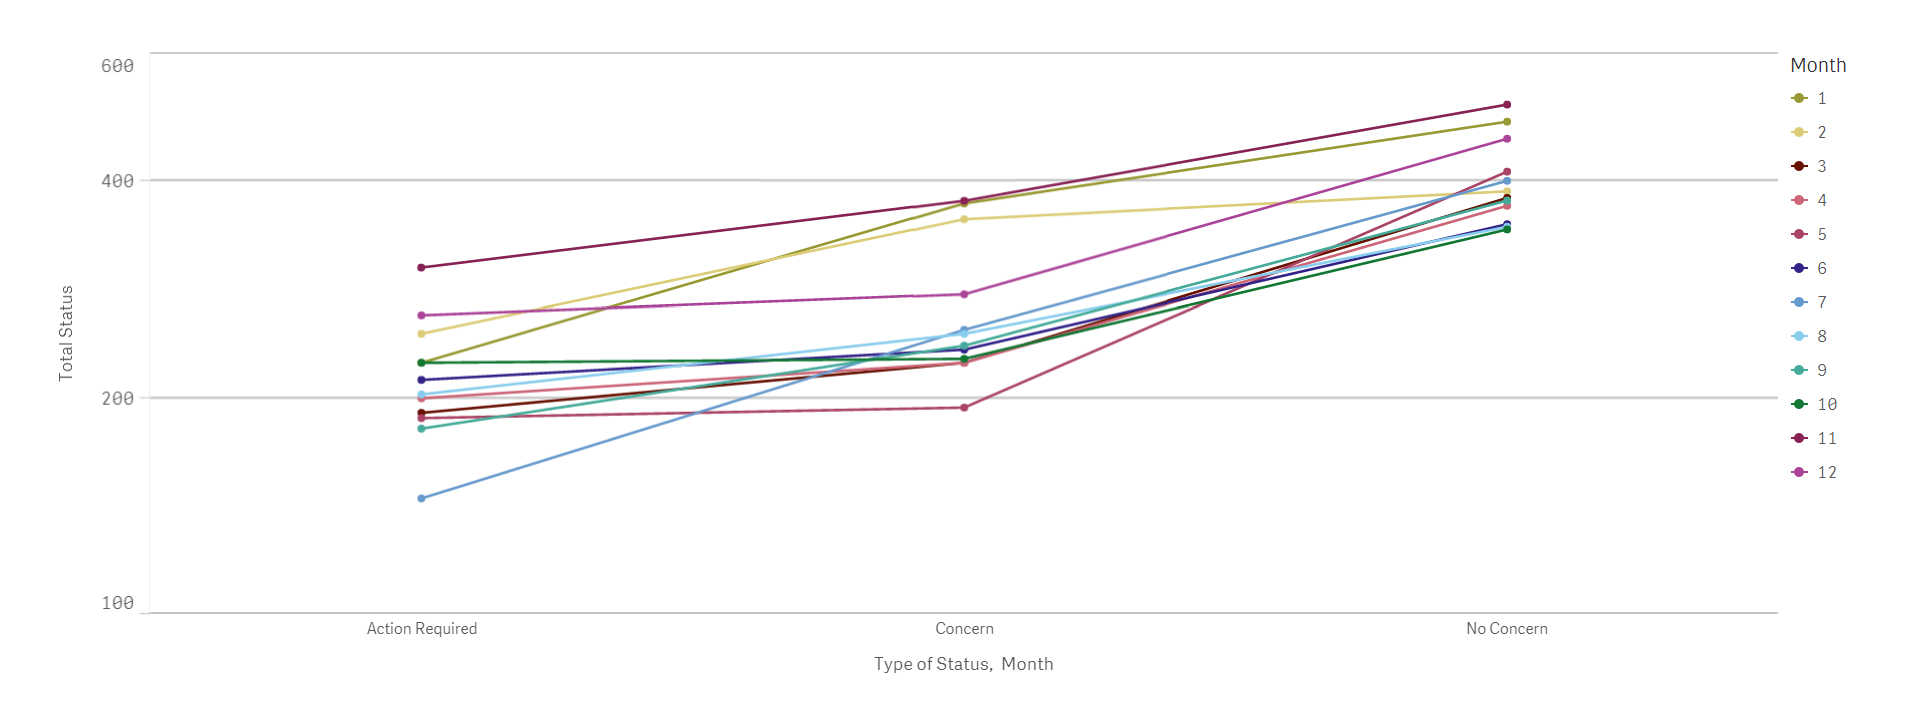
Hi Everyone,
I want to display january and february only in this line chart.
Thank you.
- Mark as New
- Bookmark
- Subscribe
- Mute
- Subscribe to RSS Feed
- Permalink
- Report Inappropriate Content
Sum({$<Month={1,2}>} [Action Required])
If the other months in your data are from different years..
Sum({$<Year={$(=Year(Today()))}>} [Action Required])
- Mark as New
- Bookmark
- Subscribe
- Mute
- Subscribe to RSS Feed
- Permalink
- Report Inappropriate Content
What the data that I need to put in action required?
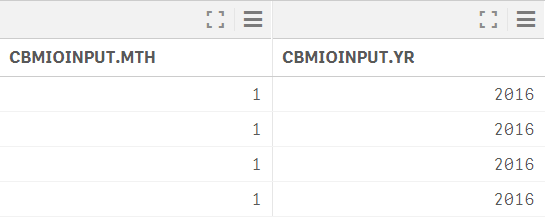
I tried do like this -> =Sum({$<[CBMIOINPUT.YR]={$(=[CBMIOINPUT.YR](Today()))}>} [Action Required]) . but it shows invalid dimension.
- Mark as New
- Bookmark
- Subscribe
- Mute
- Subscribe to RSS Feed
- Permalink
- Report Inappropriate Content
What the data that I need to put in action required?

I tried do like this -> =Sum({$<[CBMIOINPUT.YR]={$(=[CBMIOINPUT.YR](Today()))}>} [Action Required]) . but it shows invalid dimension.
- Mark as New
- Bookmark
- Subscribe
- Mute
- Subscribe to RSS Feed
- Permalink
- Report Inappropriate Content
Use the dimension you used in the line chart to get Total Status. I am guessing its name is not "Action Required"...
And [CBMIOINPUT.YR](Today()) is not valid.
As David suggested, to get this year's Jan and Feb data:
Sum({$<[CBMIOINPUT.YR]={"$(=Year(Today()))"}, [CBMIOINPUT.YR]={1,2}>} [your dimension's name])