Unlock a world of possibilities! Login now and discover the exclusive benefits awaiting you.

- Qlik Community
- :
- Forums
- :
- Analytics & AI
- :
- Products & Topics
- :
- App Development
- :
- How to have fixed/static dimension?
- Subscribe to RSS Feed
- Mark Topic as New
- Mark Topic as Read
- Float this Topic for Current User
- Bookmark
- Subscribe
- Mute
- Printer Friendly Page

 newmcm
- Mark as New
- Bookmark
- Subscribe
- Mute
- Subscribe to RSS Feed
- Permalink
- Report Inappropriate Content
How to have fixed/static dimension?
Hi All,
I have 3 columns in my mock up data. i.e. Unit, Epi_month, Name.
I plotted them on a graph, dimension: Epi_month, measures: Count(distinct name)
I have a filter: Unit.
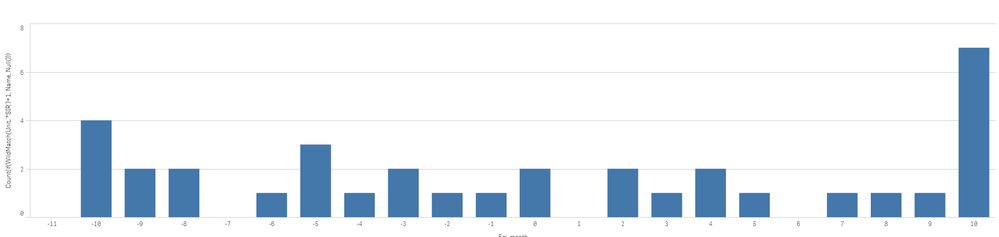
When i filter for a unit, the graph and dimension reduces to:
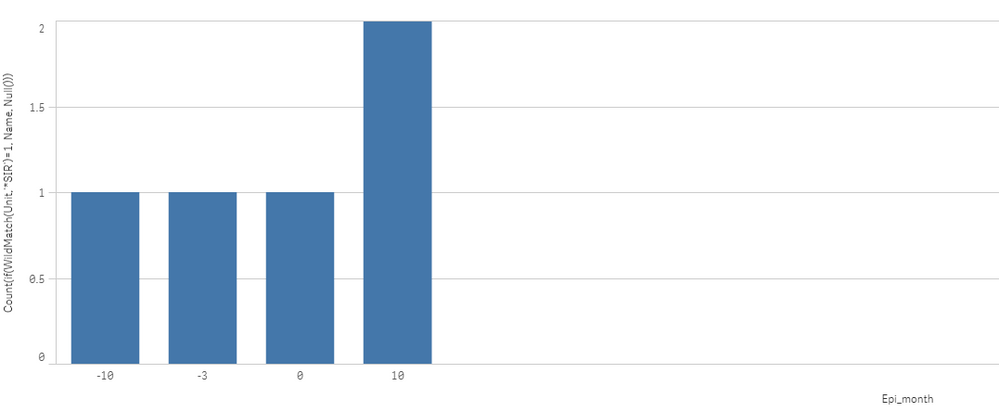
Is there anyway I can continue to show -11 to 10 in the dimension. So those missing values are shown as 0 in the graph?
Edit: attaching my mock up data as well.
Accepted Solutions

 rubenmarin
- Mark as New
- Bookmark
- Subscribe
- Mute
- Subscribe to RSS Feed
- Permalink
- Report Inappropriate Content
Sum({1} aggr(count(Name), Epi_month))

 benvatvandata
- Mark as New
- Bookmark
- Subscribe
- Mute
- Subscribe to RSS Feed
- Permalink
- Report Inappropriate Content
See if changing your measure to this works:
count({1} aggr( count([distinct name]), Epi_month))
- Ben
rubenmarin
- Mark as New
- Bookmark
- Subscribe
- Mute
- Subscribe to RSS Feed
- Permalink
- Report Inappropriate Content
Sum({1} aggr(count(Name), Epi_month))
newmcm
- Mark as New
- Bookmark
- Subscribe
- Mute
- Subscribe to RSS Feed
- Permalink
- Report Inappropriate Content
newmcm
- Mark as New
- Bookmark
- Subscribe
- Mute
- Subscribe to RSS Feed
- Permalink
- Report Inappropriate Content
@benvatvandata wrote:See if changing your measure to this works:
count({1} aggr( count([distinct name]), Epi_month))
- Ben
Wouldn't this makes my filter for useless already?
newmcm
- Mark as New
- Bookmark
- Subscribe
- Mute
- Subscribe to RSS Feed
- Permalink
- Report Inappropriate Content
@rubenmarin wrote:
or maybe:
Sum({1} aggr(count(Name), Epi_month))
Thanks! this works wonder!
Would you be able to explain the rational/logic behind please?
rubenmarin
- Mark as New
- Bookmark
- Subscribe
- Mute
- Subscribe to RSS Feed
- Permalink
- Report Inappropriate Content
Hi, it counts Name's for each Epi_month, all inside a sum to keep the value ofthe insider Sum, and using {1} to ignore selections and allow to show all dimension values.
It's very similar to the one posted by @benvatvandata, just changed the Count by a Sum, because the count will return 1, but the sum keeps the value of the insider Count().
