Unlock a world of possibilities! Login now and discover the exclusive benefits awaiting you.
- Qlik Community
- :
- Forums
- :
- Analytics & AI
- :
- Products & Topics
- :
- App Development
- :
- Re: How to make QS bar chart same like QV bar char...
- Subscribe to RSS Feed
- Mark Topic as New
- Mark Topic as Read
- Float this Topic for Current User
- Bookmark
- Subscribe
- Mute
- Printer Friendly Page
- Mark as New
- Bookmark
- Subscribe
- Mute
- Subscribe to RSS Feed
- Permalink
- Report Inappropriate Content
How to make QS bar chart same like QV bar chart ?
Hi All
I have 1 chart from QS another from QV , both have similar expression and dimension.
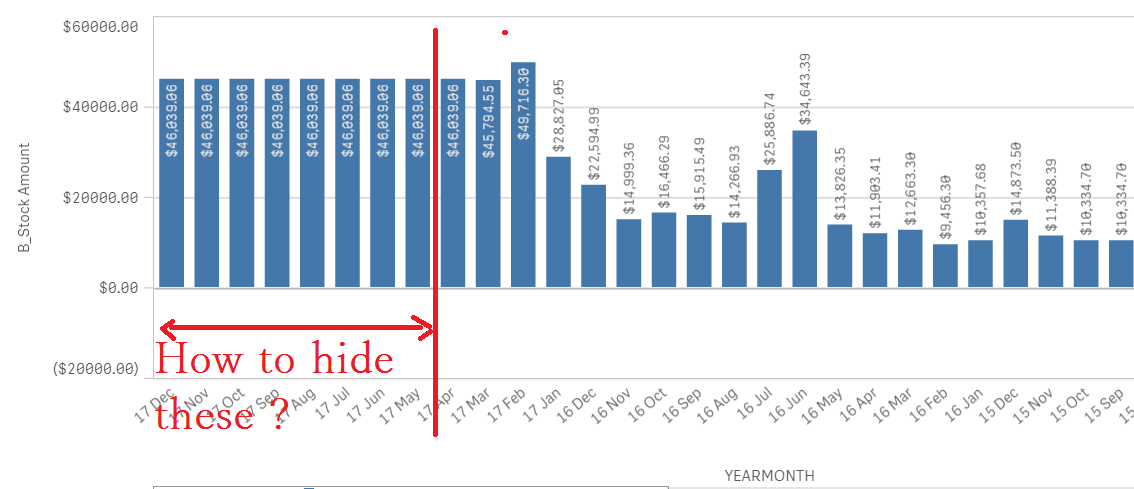
May i know how to make QS remove those bar which is from May 2017 - Dec 2017 ? Since QV does not display them , not sure why QS display those bar which is not necessary.
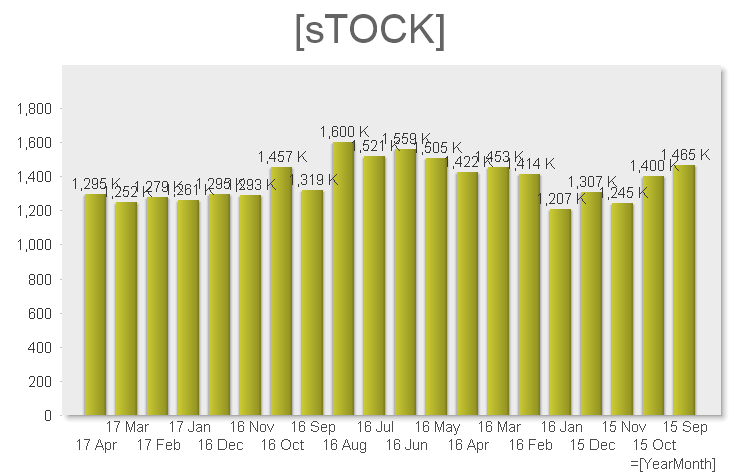
Above chart is from QV which is okay.
Below chart from QS is not okay.
- Mark as New
- Bookmark
- Subscribe
- Mute
- Subscribe to RSS Feed
- Permalink
- Report Inappropriate Content
You could use an if statement in your expression - if(YEARMONTH<DATE, Null(), YEARMONTH) - then make sure show nulls is not ticked.
- Mark as New
- Bookmark
- Subscribe
- Mute
- Subscribe to RSS Feed
- Permalink
- Report Inappropriate Content
Hi Bella
I have try , but it still the same. In Qlik View it does not have any issue.
The reasons is i have sales target date for 2017 from jan till Dec , and they QS think that date are there.
Also my expression are quite complicated :-
(
money(
(RangeSum(Above(RangeSum
(Above(
Sum
(
{
<
year, month,sTOCK={sTOCK}
>
}
[Amount])/Rate, 0, RowNo()))),
-
Sum(
{
<
sTOCK={sTOCK}>
}
TOTAL Aggr(Sum(
{
<
year, month, sTOCK={sTOCK}
>
}
[Amount])/Rate, YearMonth
))))
, $(vMoneyFormatK))
)
Paul Yeo
- Mark as New
- Bookmark
- Subscribe
- Mute
- Subscribe to RSS Feed
- Permalink
- Report Inappropriate Content
HI All
look like QV work fine because it have some hidden feature which QS does not have.
paul