Unlock a world of possibilities! Login now and discover the exclusive benefits awaiting you.
- Qlik Community
- :
- Forums
- :
- Analytics & AI
- :
- Products & Topics
- :
- App Development
- :
- Re: How to produce a table displaying the peak mon...
- Subscribe to RSS Feed
- Mark Topic as New
- Mark Topic as Read
- Float this Topic for Current User
- Bookmark
- Subscribe
- Mute
- Printer Friendly Page
- Mark as New
- Bookmark
- Subscribe
- Mute
- Subscribe to RSS Feed
- Permalink
- Report Inappropriate Content
How to produce a table displaying the peak month of a year per dim value?
Hello,
I would like to know if the following is possible, and if yes, how?
I have a set of data from which I am looking to ascertain the peak month for transactions by merchant in a given year. In a pivot table, the data might look like so:
Merchant | Jan | Feb | Mar |
|---|---|---|---|
| A | 15 | 25 | 35 |
| B | 10 | 25 | 5 |
| C | 30 | 10 | 20 |
These are all values for 2017 (filtered). There would be 12 months of data here and thousands of merchants.
The transaction values are created with the expression Sum([Transactions]).
I would like to know if there is some way of displaying the maximum value for each merchant across the months, either by 1) displaying a table with three columns: merchant, month containing the maximum value (Peak Month) and the value itself or 2) displaying the above pivot with the maximum values highlighted:
| Example Option 1 | ||
|---|---|---|
| Merchant | Peak Month | Max Value |
| A | Mar | 35 |
| B | Feb | 25 |
| C | Jan | 30 |
| Example Option 2 | |||
|---|---|---|---|
| Merchant | Jan | Feb | Mar |
| A | 15 | 25 | 35 |
B | 10 | 25 | 5 |
| C | 30 | 10 | 20 |
I cannot edit the data load.
Any help would be greatly appreciated - even confirmation that this cannot be achieved without editing the data load!
Steph
Message was edited by: Stephanie
Accepted Solutions
- Mark as New
- Bookmark
- Subscribe
- Mute
- Subscribe to RSS Feed
- Permalink
- Report Inappropriate Content
This was my bad, can you try this
FirstSortedValue(Month, -Aggr(Sum(Transactions), Month, Merchant))
Max(Aggr(Sum(Transactions), Month, Merchant))
and
If(Max(TOTAL <Merchant> Aggr(Sum(Transactions), Month, Merchant)) = Sum(Transactions), Yellow())
- Mark as New
- Bookmark
- Subscribe
- Mute
- Subscribe to RSS Feed
- Permalink
- Report Inappropriate Content
May be this for 1st example chart
Dimension
Merchant
Expression
FirstSortedValue(Month, -Value)
Max(Value)
For the second example chart, you can use a background color expression like this
If(Max(TOTAL <Merchant> Value) = Value, Yellow())
- Mark as New
- Bookmark
- Subscribe
- Mute
- Subscribe to RSS Feed
- Permalink
- Report Inappropriate Content
Hi Sunny,
Thank you, but I'm afraid I missed out an important bit of information - the Value is Sum([Transactions]). I.e. to derive my original pivot table, the Row would be 'Merchant', the Column 'Month' and the Measure Sum([Transactions]).
This prevents me from nesting into the FirstSortedValue expression in the first table.
I'll edit my question to reflect this!
- Mark as New
- Bookmark
- Subscribe
- Mute
- Subscribe to RSS Feed
- Permalink
- Report Inappropriate Content
Try this
FirstSortedValue(Month, -Aggr(Sum(Transactions), Month))
Max(Aggr(Sum(Transactions), Month))
For the other one
If(Max(TOTAL <Merchant> Aggr(Sum(Transactions), Month)) = Sum(Transactions), Yellow())
- Mark as New
- Bookmark
- Subscribe
- Mute
- Subscribe to RSS Feed
- Permalink
- Report Inappropriate Content
Sorry Sunny. No luck with either of those, I'm afraid. The first returns a column containing the three months with the most transactions and another with the sum of those transactions. The second doesn't appear to colour anything. 
- Mark as New
- Bookmark
- Subscribe
- Mute
- Subscribe to RSS Feed
- Permalink
- Report Inappropriate Content
Can you share an image of what you get and explain what you intend to get?
- Mark as New
- Bookmark
- Subscribe
- Mute
- Subscribe to RSS Feed
- Permalink
- Report Inappropriate Content
Hi Sunny,
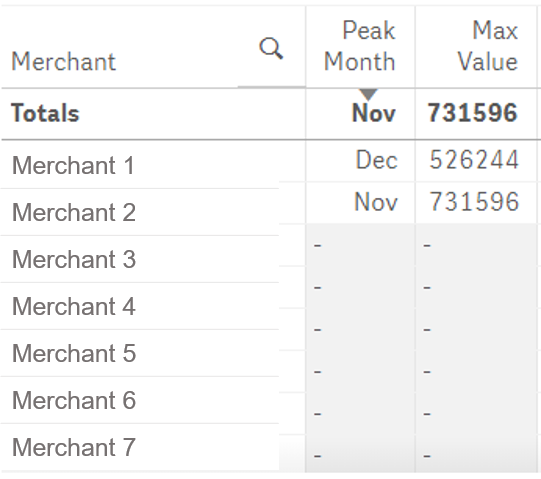
This is the table I get using your expressions (anonymised). I have a column of all the merchants, but the peak month column shows only those months which have the highest max value in total for one year (regardless of merchant). All other rows besides the first two are blank.
What I intend to get is a Merchant column displaying all merchants, a Peak Month column displaying the month in a given year (2017) in which the merchant saw the most transactions, and a Max Value, which displays the sum of transactions for that merchant in their peak month.
So in my first example in my question (the blue headed table), Merchant A saw the most transactions in March, so I would want to display Merchant A / March / 35.
With that in mind, I seem to be having some success with HRank in a pivot table, but it's still not quite what I'm after:
Row:
Merchant
Column:
Month
Measures:
Sum([Transactions])
Hrank(sum([Transactions]),4,1)
This creates something like this:

- Mark as New
- Bookmark
- Subscribe
- Mute
- Subscribe to RSS Feed
- Permalink
- Report Inappropriate Content
This was my bad, can you try this
FirstSortedValue(Month, -Aggr(Sum(Transactions), Month, Merchant))
Max(Aggr(Sum(Transactions), Month, Merchant))
and
If(Max(TOTAL <Merchant> Aggr(Sum(Transactions), Month, Merchant)) = Sum(Transactions), Yellow())
- Mark as New
- Bookmark
- Subscribe
- Mute
- Subscribe to RSS Feed
- Permalink
- Report Inappropriate Content
You've cracked it! Thank you so much, Sunny. 