Unlock a world of possibilities! Login now and discover the exclusive benefits awaiting you.
- Qlik Community
- :
- Forums
- :
- Analytics & AI
- :
- Products & Topics
- :
- App Development
- :
- Ignore Selections - Line Chart
- Subscribe to RSS Feed
- Mark Topic as New
- Mark Topic as Read
- Float this Topic for Current User
- Bookmark
- Subscribe
- Mute
- Printer Friendly Page
- Mark as New
- Bookmark
- Subscribe
- Mute
- Subscribe to RSS Feed
- Permalink
- Report Inappropriate Content
Ignore Selections - Line Chart
Hi Sunny/Kush,
I've seen you post about this issue in a few other places, but none of them seemed to address my particular issue - I am hoping it's an easy one.
I need to harden a line chart so that the dimension [date field] does not respond to selections on that field. I have the following:
Line Chart:
Dimension: [(Keyport_Master......).Date]
Measures (I have tried the following)
sum( {1<[(Keyport_Master......).Date] = $::[(Keyport_Master......).Date] >} total <[(Keyport_Master......).Date]> [(Keyport_Master......).LI] )
sum( {1<[(Keyport_Master......).Date] = >} [(Keyport_Master......).LI] )
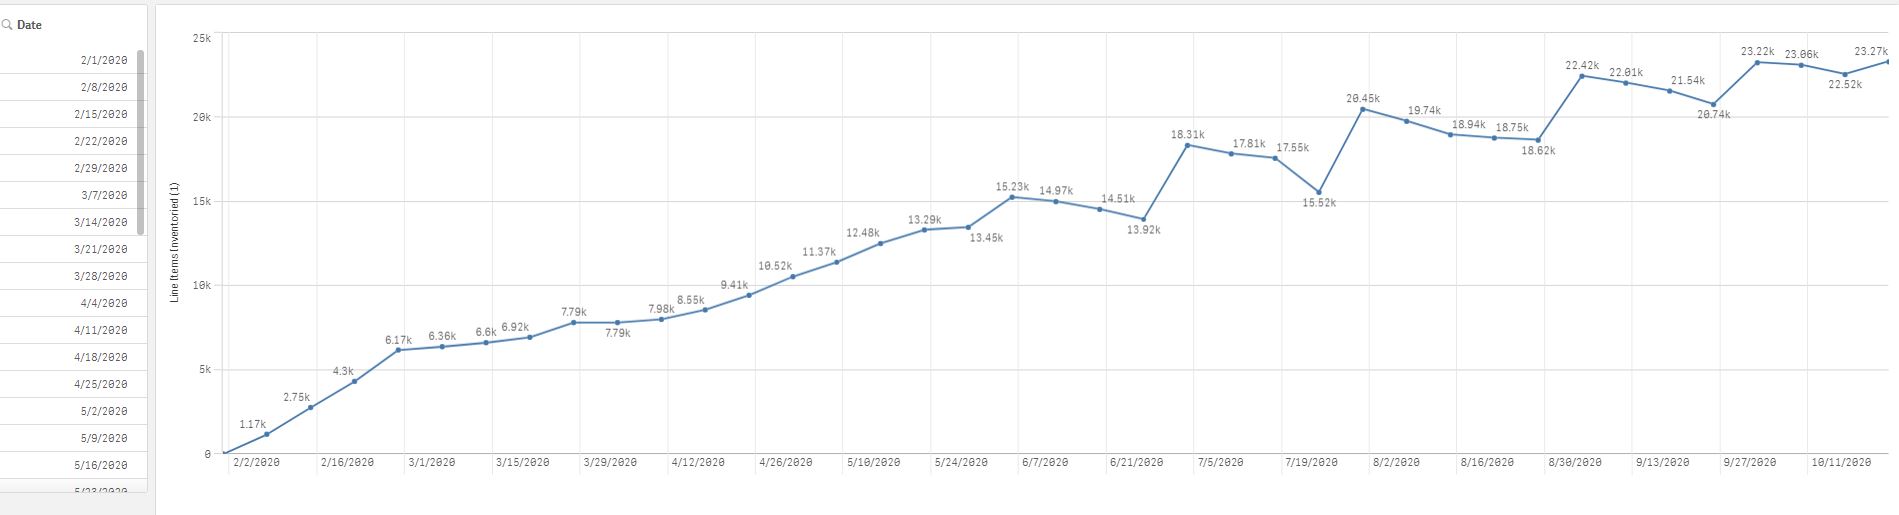
I've tried some other rando things with AGGR in the dimension but no luck. Every time I make a selection on the date field, it adjusts the linechart to only display that date and everything else goes to 0. I want the linechart to ignore the selection and show accumulation for all time. Your help is greatly appreciated!
-
Ben
- Tags:
- line chart
- Mark as New
- Bookmark
- Subscribe
- Mute
- Subscribe to RSS Feed
- Permalink
- Report Inappropriate Content
Hi Ben,
I think you can find an answer to your question in my blog article here:
https://www.naturalsynergies.com/q-tip-20-showing-all-values-in-qlik-sense/
Also, I'd like to invite you to my lecture on Set Analysis and AGGR, that I will be delivering on-line on November 18th. You will learn many valuable techniques that can be used for advanced analytics, using AGGR and Set Analysis. Check out the link to the Masters Summit for Qlik in my signature below.
Cheers,
- Mark as New
- Bookmark
- Subscribe
- Mute
- Subscribe to RSS Feed
- Permalink
- Report Inappropriate Content
This is an interesting post. Unfortunately, when I plug my fields in my graph goes to 0 across the board. I did notice, and should have mentioned, I am utilizing the accumulation modifier on my measure. When I turn that off, the graph does display the sum per date point. However, if I make a date selection, the graph still adjusts and my selections are not ignored. How to do with accumulation? Here are my expressions:
Dimension: AGGR( {1} only([(Keyport_Master......).Date]), [(Keyport_Master......).Date])
Measure:
Sum({1}
aggr(sum({< [Material Code]={'2'}>} [(Keyport_Master......).QTY]),[(Keyport_Master......).Date]))
- Mark as New
- Bookmark
- Subscribe
- Mute
- Subscribe to RSS Feed
- Permalink
- Report Inappropriate Content
Hi Ben,
I think you are almost there, however your problem is slightly different from the one that I had described in my article, hence you need a bit more tweaking. I see two possible issues (both are reviewed in detail in my class):
1. In order to ignore all selections, you need to use the Set Analysis Identifier 1 both inside and outside of the AGGR function, like this:
Sum({1}
aggr(sum({1< [Material Code]={'2'}>} [(Keyport_Master......).QTY]),[(Keyport_Master......).Date]))
2. The Aggregation Modifier works well with simple formulas that don't have any special tricks. In our case, we should implement the same aggregation manually - using the functions RangeSum() and Above(). The formula should look like this (typing from memory, please forgive me if I miss something):
Sum({1}
aggr(
RangeSum(
Above(
sum({1< [Material Code]={'2'}>} [(Keyport_Master......).QTY])
, 0, RowNo())
)
,[(Keyport_Master......).Date]))
This should solve your current problem. If you'd like to master these techniques and solve similar problems by yourself, come to my class on November 18th.
Cheers,