Unlock a world of possibilities! Login now and discover the exclusive benefits awaiting you.
- Qlik Community
- :
- Forums
- :
- Analytics & AI
- :
- Products & Topics
- :
- App Development
- :
- Re: Ignore current selections within an aggr funct...
- Subscribe to RSS Feed
- Mark Topic as New
- Mark Topic as Read
- Float this Topic for Current User
- Bookmark
- Subscribe
- Mute
- Printer Friendly Page
- Mark as New
- Bookmark
- Subscribe
- Mute
- Subscribe to RSS Feed
- Permalink
- Report Inappropriate Content
Ignore current selections within an aggr function
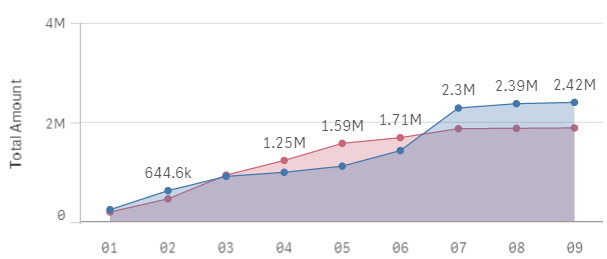
In Qlik Sense I'm using the following function as a measure to get a cumulative chart with two dimensions.
=aggr(rangesum(above(sum(TotalAmount), 0, rowno() )), Time.Year, [Time.Year Week])
That is working well and produces the graph shown below (I'm using some simple IF statements in the dimensions to constrain them to current/previous years and weeks to date).
Now I want to use set analysis to ignore current selections in the values. I can't figure out how to modify the function above to achieve that. Any suggestions?
Accepted Solutions
- Mark as New
- Bookmark
- Subscribe
- Mute
- Subscribe to RSS Feed
- Permalink
- Report Inappropriate Content
=sum({1}aggr(rangesum(above(sum({1}TotalAmount), 0, rowno() )), Time.Year, [Time.Year Week]))
talk is cheap, supply exceeds demand
- Mark as New
- Bookmark
- Subscribe
- Mute
- Subscribe to RSS Feed
- Permalink
- Report Inappropriate Content
=sum({1}aggr(rangesum(above(sum({1}TotalAmount), 0, rowno() )), Time.Year, [Time.Year Week]))
talk is cheap, supply exceeds demand
- Mark as New
- Bookmark
- Subscribe
- Mute
- Subscribe to RSS Feed
- Permalink
- Report Inappropriate Content
Thanks Gysbert,
If I'm honest, I don't know exactly why the solution involved putting a sum() around all of it... but it does feel right and it does work.
I had tried putting {1} before TotalAmount. My grasp of set analysis, aggr and rangesum is still a bit tenuous.
Best,
Matt
- Mark as New
- Bookmark
- Subscribe
- Mute
- Subscribe to RSS Feed
- Permalink
- Report Inappropriate Content
Adding a prefix of Sum({1} to the aggr function is still a solution in 2020.
Thanks