Unlock a world of possibilities! Login now and discover the exclusive benefits awaiting you.
- Qlik Community
- :
- Forums
- :
- Analytics & AI
- :
- Products & Topics
- :
- App Development
- :
- Ignore one dimension in above function
- Subscribe to RSS Feed
- Mark Topic as New
- Mark Topic as Read
- Float this Topic for Current User
- Bookmark
- Subscribe
- Mute
- Printer Friendly Page
- Mark as New
- Bookmark
- Subscribe
- Mute
- Subscribe to RSS Feed
- Permalink
- Report Inappropriate Content
Ignore one dimension in above function
Hi,
I'd like to plot a chart with a cumulative sum over time, and split it into groups (one cumulative sum per group)
I tried a line chart with two dimensions FEC_PETICION (date) and BALANCE_GROUP_DESC (group description string)
And the next measure:
Rangesum(
above(Sum({$<ERROR={0}>}[BALANCE_FACTOR]),
0,
vMaxDays
)
)
It's not working because the BALANCE_GROUP_DESC is interfering the cumulative sum.
I'd tried the next, but QlikSense doesn't allow exceptions to TOTAL clause for above function ¿?
Rangesum(
above(TOTAL<FEC_PETICION> Sum({$<ERROR={0}>}[BALANCE_FACTOR]),
0,
vMaxDays
)
)
How could I ignore the date FEC_PETICION for cumulative sum, but use it to draw separately each cumulative sum into groups?
A sample application is attached.
TIA,
Virilo
Accepted Solutions
- Mark as New
- Bookmark
- Subscribe
- Mute
- Subscribe to RSS Feed
- Permalink
- Report Inappropriate Content
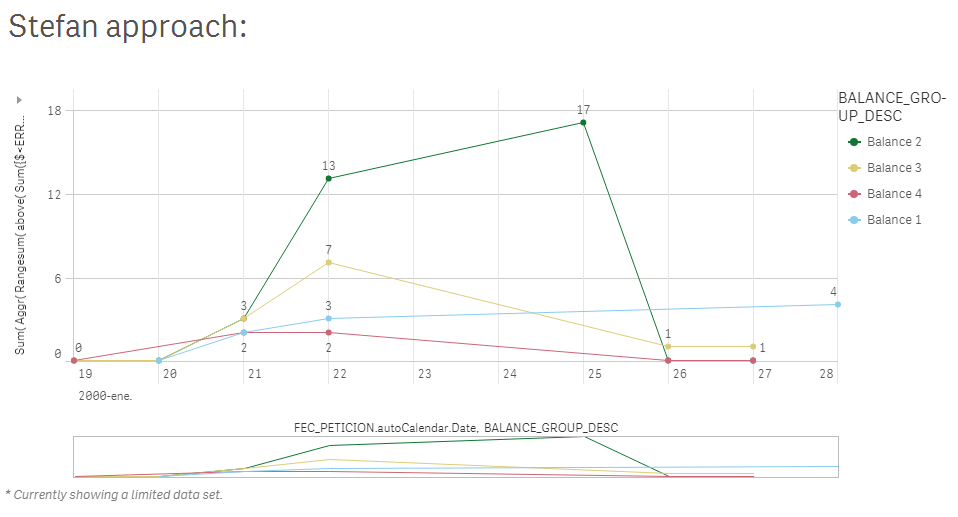
May be your date isn't sorted correctly in the script... and you need this
Sum(
Aggr(
Rangesum(
above( Sum({$<ERROR={0}>}[BALANCE_FACTOR]),
0,
vMaxDays
)
)
, BALANCE_GROUP_DESC , (FEC_PETICION.autoCalendar.Date, (NUMERIC))
)
)
Read about The sortable Aggr function is finally here!
- Mark as New
- Bookmark
- Subscribe
- Mute
- Subscribe to RSS Feed
- Permalink
- Report Inappropriate Content
Try something like
Sum( Aggr(
Rangesum(
above( Sum({$<ERROR={0}>}[BALANCE_FACTOR]),
0,
vMaxDays
)
)
, BALANCE_GROUP_DESC , FEC_PETICION
))
Note the swapped dimension order in the Aggr() dimension list.
- Mark as New
- Bookmark
- Subscribe
- Mute
- Subscribe to RSS Feed
- Permalink
- Report Inappropriate Content
Hi Stefan,
Thanks a lot. I read https://help.qlik.com/en-US/sense/June2018/Subsystems/Hub/Content/ChartFunctions/aggr.htm and tried your solution without success 
I have attached a sample application if it helps.
Best regards,
Virilo
- Mark as New
- Bookmark
- Subscribe
- Mute
- Subscribe to RSS Feed
- Permalink
- Report Inappropriate Content
May be your date isn't sorted correctly in the script... and you need this
Sum(
Aggr(
Rangesum(
above( Sum({$<ERROR={0}>}[BALANCE_FACTOR]),
0,
vMaxDays
)
)
, BALANCE_GROUP_DESC , (FEC_PETICION.autoCalendar.Date, (NUMERIC))
)
)
Read about The sortable Aggr function is finally here!
- Mark as New
- Bookmark
- Subscribe
- Mute
- Subscribe to RSS Feed
- Permalink
- Report Inappropriate Content
Thanks a lot swuehl, stalwar1,
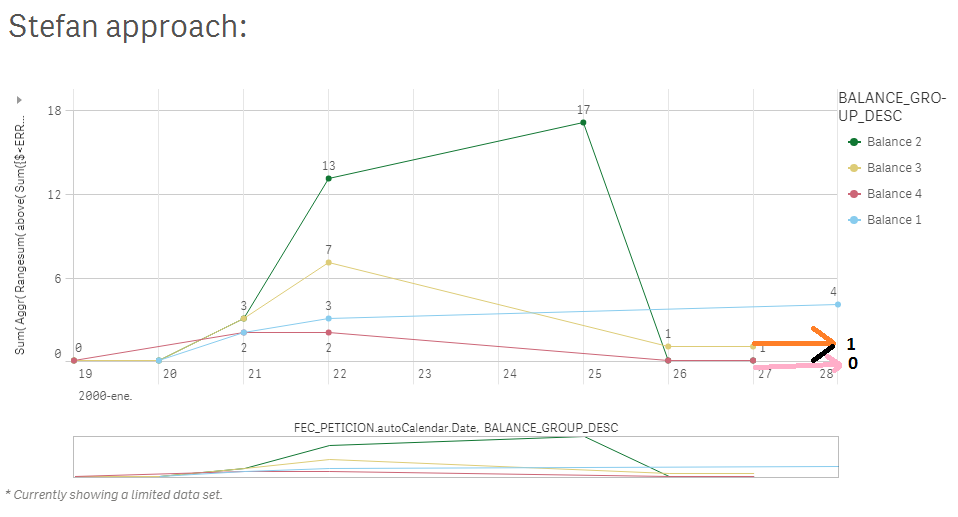
It is working!
Is it there any way to extend all the data points to the right?
I'd like people to see that at the most recent day (28-jan), the balance is:
Balance1: 4 pending messages
Balance2: 0 pending messages
Balance3: 1 pending message
Balance4: 0 pending messages
Best regards,
Virilo
- Mark as New
- Bookmark
- Subscribe
- Mute
- Subscribe to RSS Feed
- Permalink
- Report Inappropriate Content
May be you will need to Generating Missing Data In QlikView to get this done...