Unlock a world of possibilities! Login now and discover the exclusive benefits awaiting you.

- Qlik Community
- :
- Forums
- :
- Analytics & AI
- :
- Products & Topics
- :
- App Development
- :
- Limit chart by Zscore and outliers
- Subscribe to RSS Feed
- Mark Topic as New
- Mark Topic as Read
- Float this Topic for Current User
- Bookmark
- Subscribe
- Mute
- Printer Friendly Page

- Mark as New
- Bookmark
- Subscribe
- Mute
- Subscribe to RSS Feed
- Permalink
- Report Inappropriate Content
Limit chart by Zscore and outliers
I was wondering if there is a way do a limitation on the chart by Zscore if the Zscore is < 3. . currently I am doing a fractile but I also need to be able to do a Zscore check on what is shown on the screen aggregated at the dimension level for example category which is a drill down that checks if a user clicks on without outliers it does a check on IF(FABS(SUM(( UnitTotal) - AVG(TOTAL UnitTotal))/STDEV( Total UnitTotal)) < 3 than do
FRACTILE(UnitTotal,.9)) / 86400 . however when doing this it only shows outliers over the range of unit total. and not by category. So it goes from from.
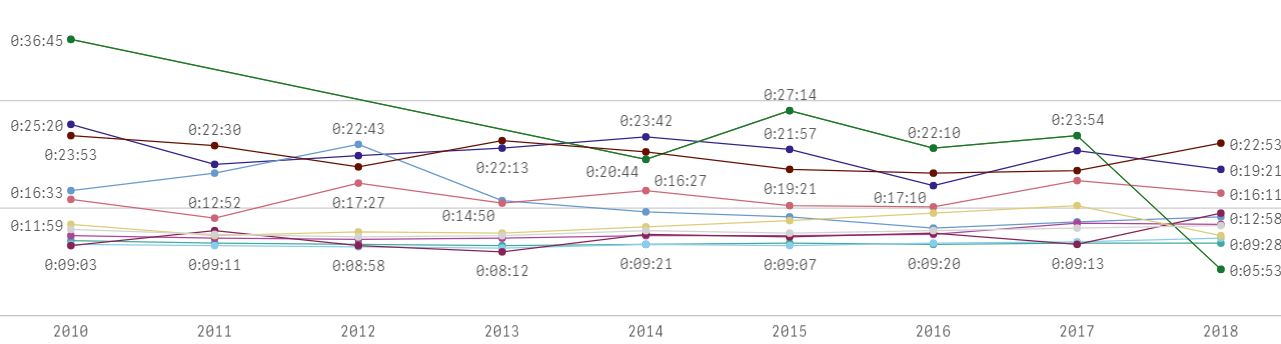
To this
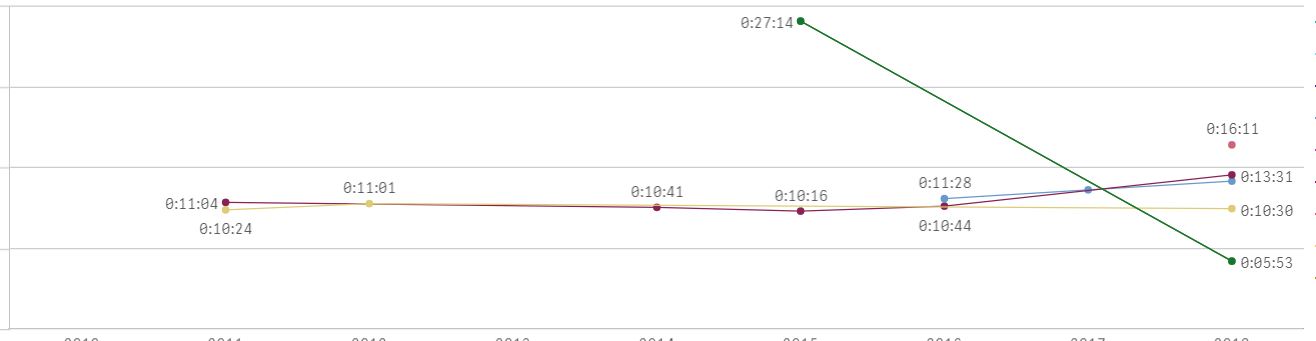
There should be a line for each category after doing this.. but it is removing categories completely.
is there a way I can utilize the dimension limitations option to enable this?
PS. This needs to be a dynamic expression that can not go in the backend because it is dependent on many variables and what the user selects.
Thank you in advance.

 sunny_talwar
- Mark as New
- Bookmark
- Subscribe
- Mute
- Subscribe to RSS Feed
- Permalink
- Report Inappropriate Content
May be try this
IF(FABS(SUM(( UnitTotal) - AVG(TOTAL <Category> UnitTotal))/STDEV( Total <Category> UnitTotal)) < 3
- Mark as New
- Bookmark
- Subscribe
- Mute
- Subscribe to RSS Feed
- Permalink
- Report Inappropriate Content
Tried it, showing the same results.
sunny_talwar
- Mark as New
- Bookmark
- Subscribe
- Mute
- Subscribe to RSS Feed
- Permalink
- Report Inappropriate Content
Would you be able to share a sample?