Unlock a world of possibilities! Login now and discover the exclusive benefits awaiting you.
- Qlik Community
- :
- Forums
- :
- Analytics & AI
- :
- Products & Topics
- :
- App Development
- :
- Re: Limit dimension in aggregated chart
- Subscribe to RSS Feed
- Mark Topic as New
- Mark Topic as Read
- Float this Topic for Current User
- Bookmark
- Subscribe
- Mute
- Printer Friendly Page
- Mark as New
- Bookmark
- Subscribe
- Mute
- Subscribe to RSS Feed
- Permalink
- Report Inappropriate Content
Limit dimension in aggregated chart
Hi.
I have such a strange problem:
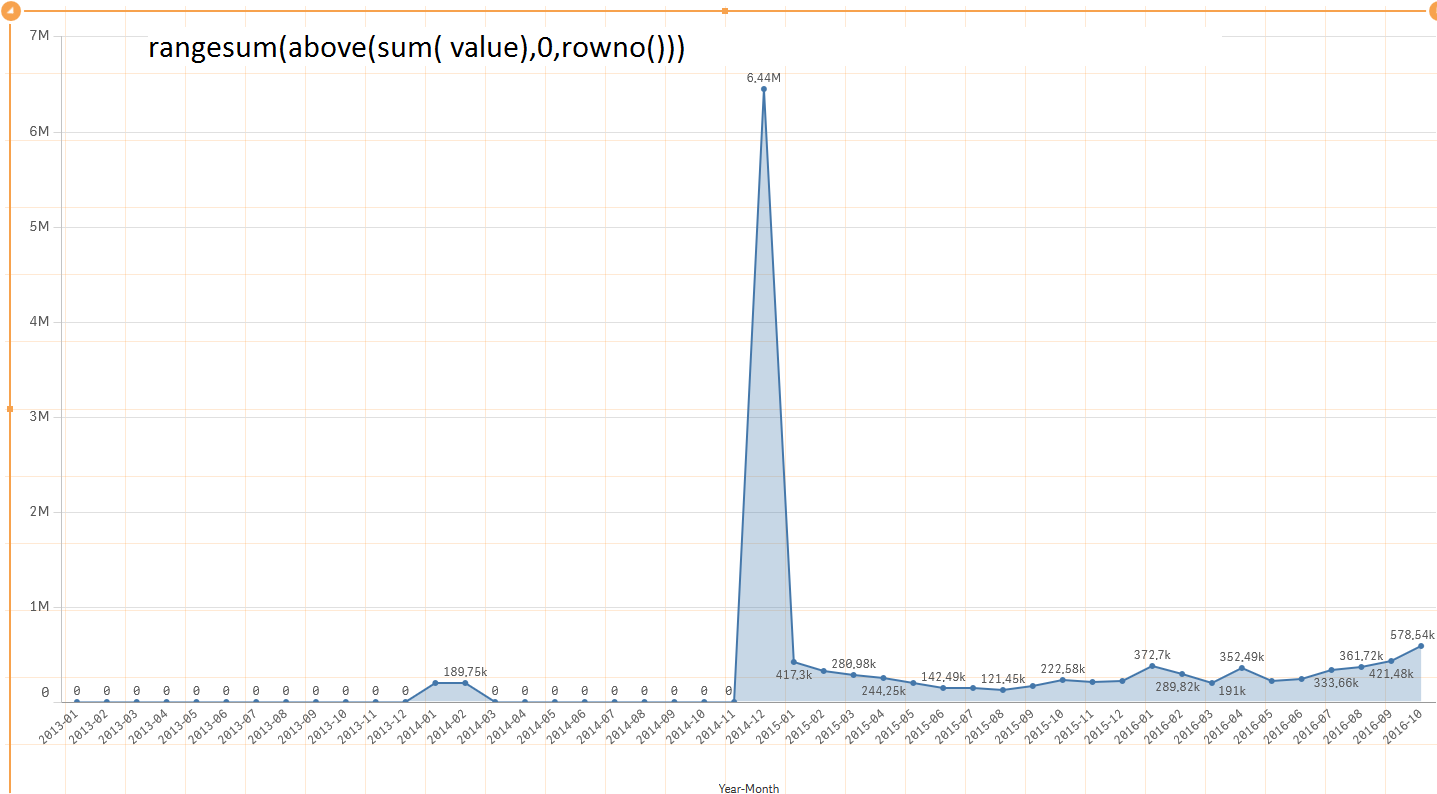
I have aggregated chart (rangesum above fo months from the begining of data till now) and it is ok. But I need to see only last 12 months of it.
I cannot limit dimension for top 12 (months) becouse I need calculate all months.
Screens below. I hope anybody can help.
And if I limit this chart with dimension settings or set expression I will only get calculated last 12 months which is wrong.
- « Previous Replies
-
- 1
- 2
- Next Replies »
Accepted Solutions
- Mark as New
- Bookmark
- Subscribe
- Mute
- Subscribe to RSS Feed
- Permalink
- Report Inappropriate Content
Sunny, can you open and have a look at this sample?
As an alternative approach, the OP could use an AsOf table:
- Mark as New
- Bookmark
- Subscribe
- Mute
- Subscribe to RSS Feed
- Permalink
- Report Inappropriate Content
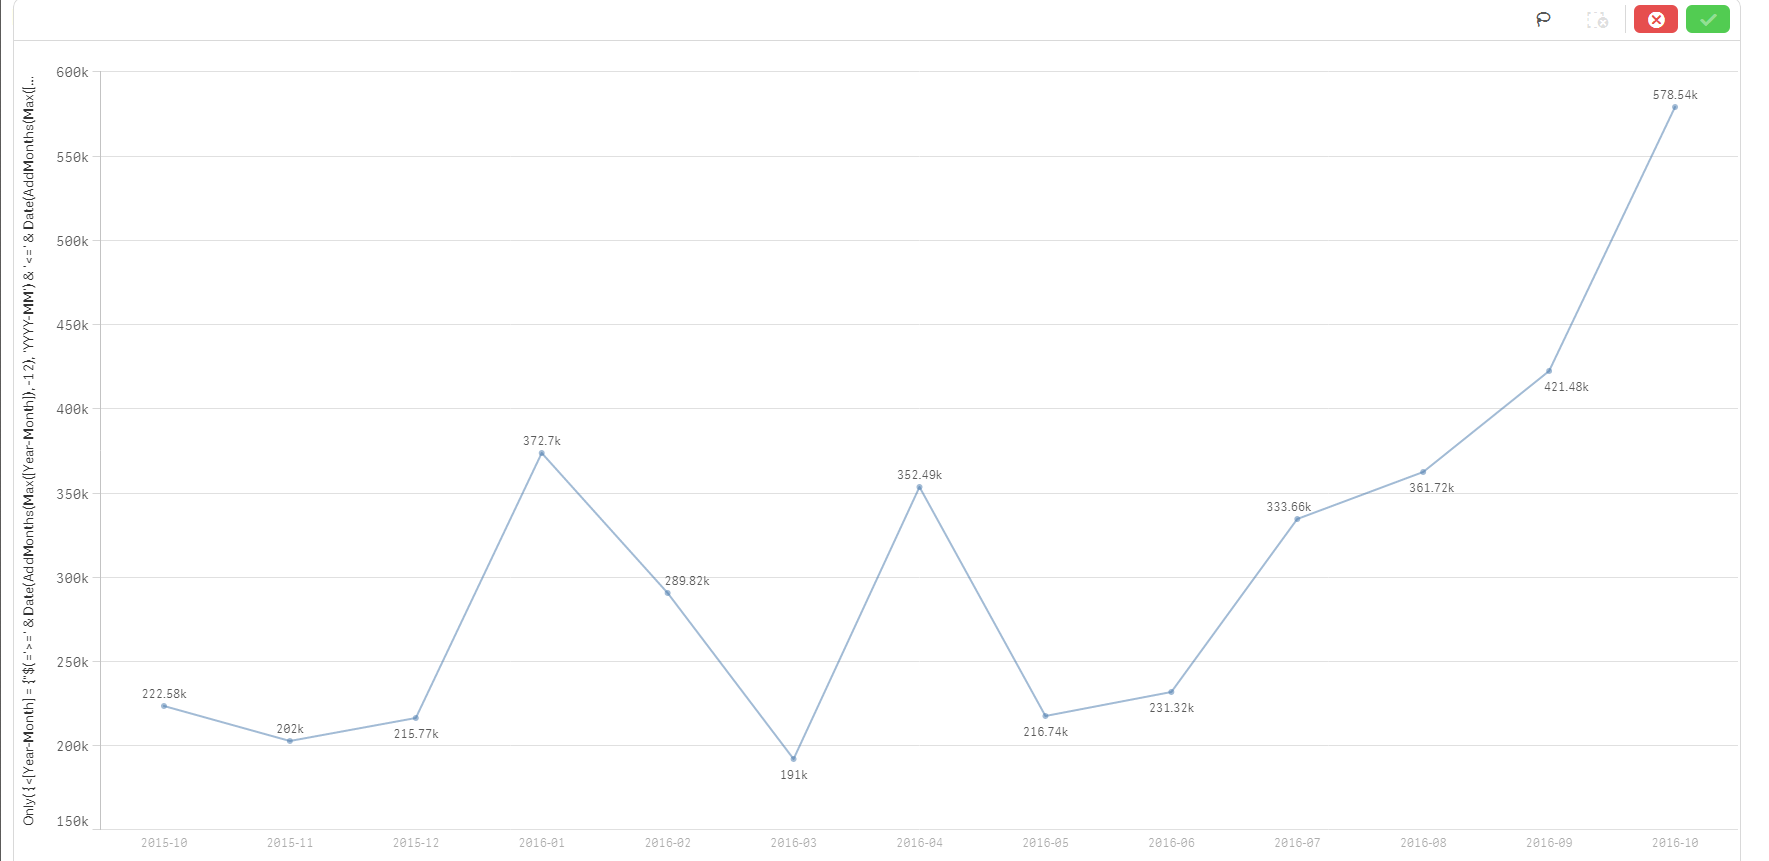
I am able to get the line chart for the part needed, but not able to remove the dates from axis:
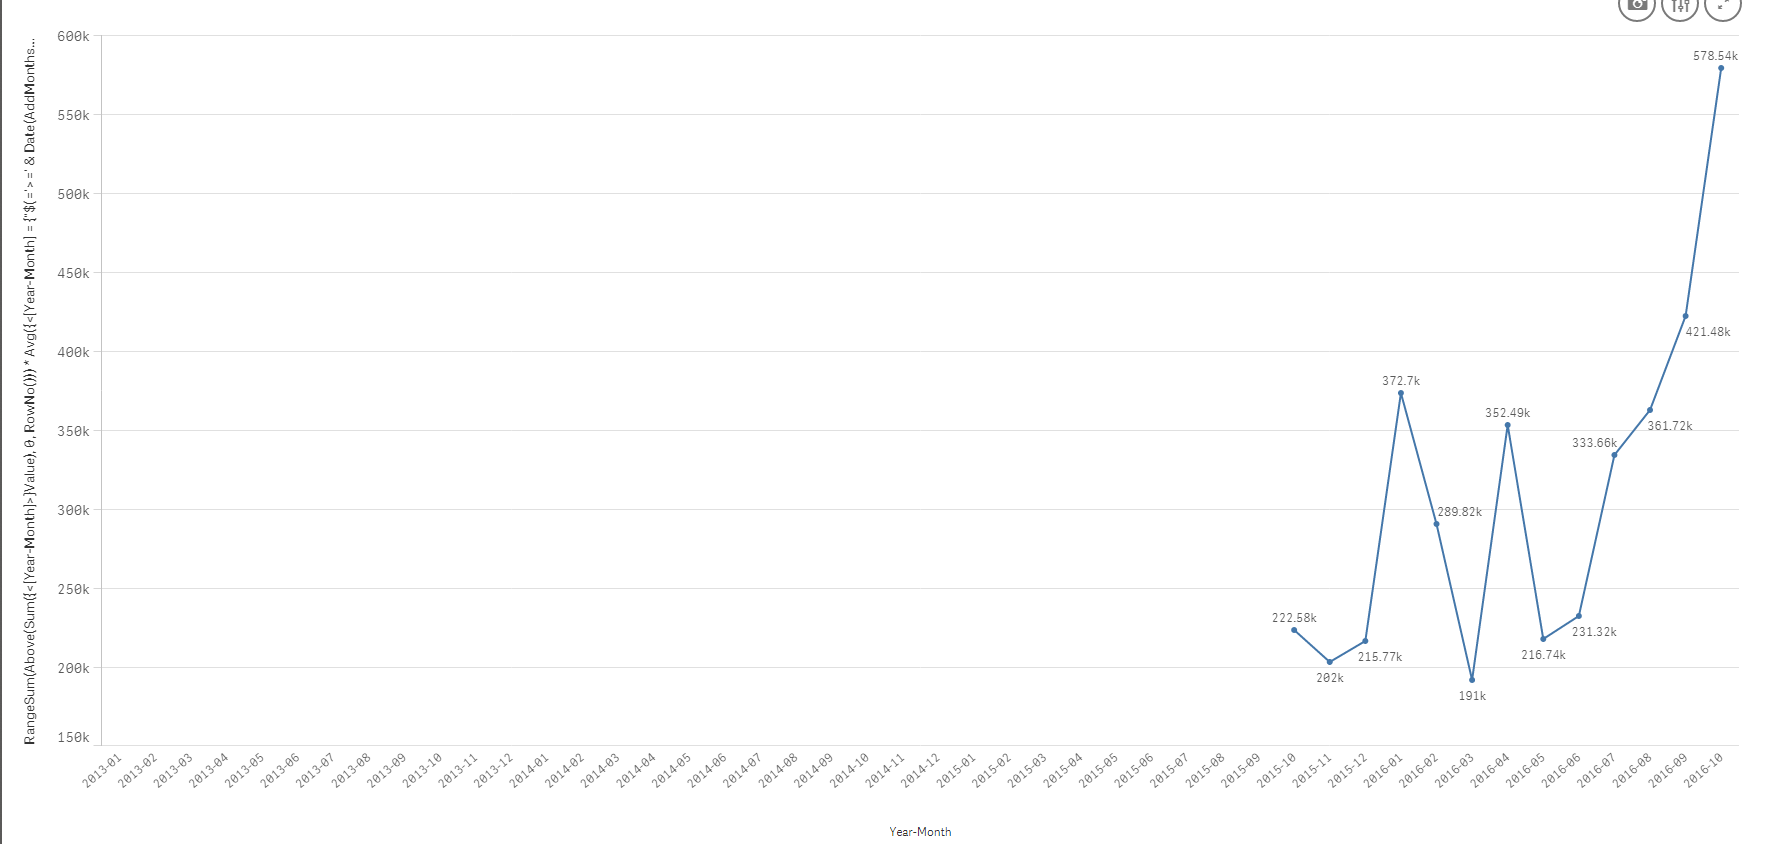
May be reddys310 can help
UPDATE: Expression used:
RangeSum(Above(Sum({<[Year-Month]>}Value), 0, RowNo())) *
Avg({<[Year-Month] = {"$(='>=' & Date(AddMonths(Max([Year-Month]), -12), 'YYYY-MM') & '<=' & Date(AddMonths(Max([Year-Month]), 0), 'YYYY-MM'))"}>}1)
- Mark as New
- Bookmark
- Subscribe
- Mute
- Subscribe to RSS Feed
- Permalink
- Report Inappropriate Content
Sunny, looks quite fine just opening your QVF:
I think I am using QS 2.1.1 still...
- Mark as New
- Bookmark
- Subscribe
- Mute
- Subscribe to RSS Feed
- Permalink
- Report Inappropriate Content
Strange, I am using this:
- Mark as New
- Bookmark
- Subscribe
- Mute
- Subscribe to RSS Feed
- Permalink
- Report Inappropriate Content
Perhaps, I am using Sense 2.2 and I see as Sunny
- Mark as New
- Bookmark
- Subscribe
- Mute
- Subscribe to RSS Feed
- Permalink
- Report Inappropriate Content
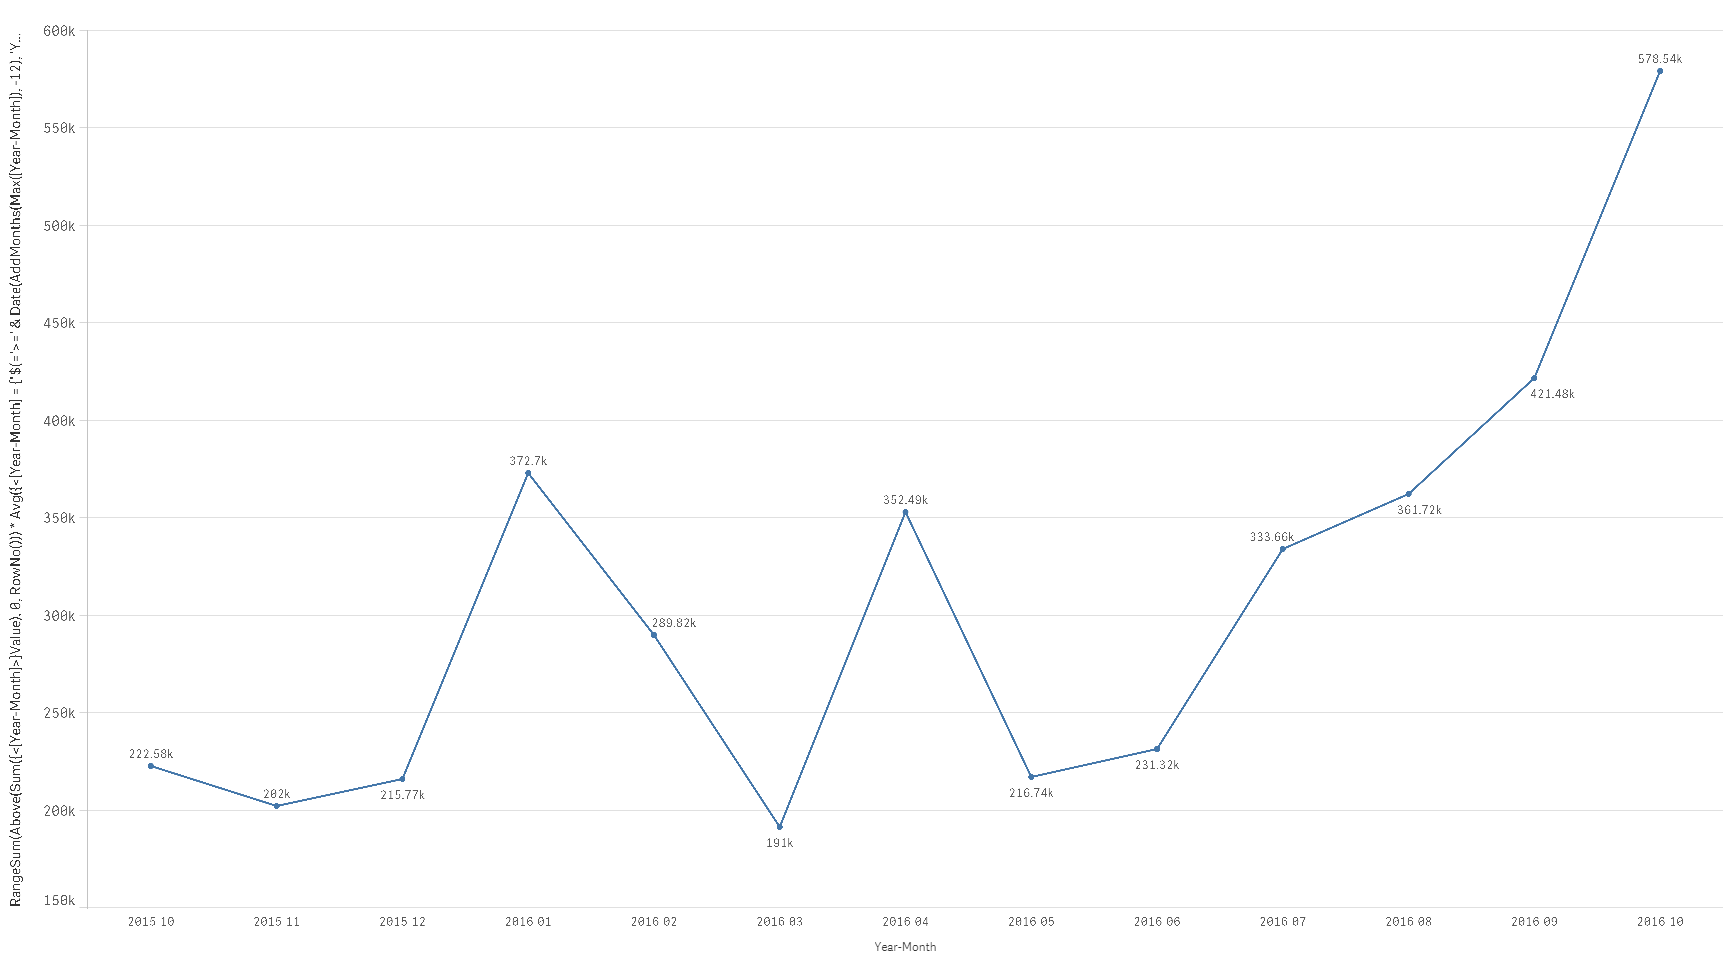
Hi Sunny and Kamil,
You can use this to remove the dates from the axis:

Thanks,
Sangram.
- Mark as New
- Bookmark
- Subscribe
- Mute
- Subscribe to RSS Feed
- Permalink
- Report Inappropriate Content
I knew it. I knew you won't disappoint me with a Qlik Sense question sangram. You are my go to man when it comes to Qlik Sense  . Thank you for your response.
- Mark as New
- Bookmark
- Subscribe
- Mute
- Subscribe to RSS Feed
- Permalink
- Report Inappropriate Content
Sunny, can you open and have a look at this sample?
As an alternative approach, the OP could use an AsOf table:
- Mark as New
- Bookmark
- Subscribe
- Mute
- Subscribe to RSS Feed
- Permalink
- Report Inappropriate Content
Hi Sunny,
Thank you so much for your kind words, but frankly speaking I am getting to learn a lot from your contributions in the community and good work. I should be the one thanking you.
- Mark as New
- Bookmark
- Subscribe
- Mute
- Subscribe to RSS Feed
- Permalink
- Report Inappropriate Content
This one looks good
- « Previous Replies
-
- 1
- 2
- Next Replies »