Unlock a world of possibilities! Login now and discover the exclusive benefits awaiting you.
- Qlik Community
- :
- Forums
- :
- Analytics & AI
- :
- Products & Topics
- :
- App Development
- :
- Line Chart 2 dimension
- Subscribe to RSS Feed
- Mark Topic as New
- Mark Topic as Read
- Float this Topic for Current User
- Bookmark
- Subscribe
- Mute
- Printer Friendly Page
- Mark as New
- Bookmark
- Subscribe
- Mute
- Subscribe to RSS Feed
- Permalink
- Report Inappropriate Content
Line Chart 2 dimension
Hi All,
I am currently developing a dashboard , and I want it to show the data like in Figure 1 showing all of the data points at the X-axis

Figure 1
However when I tried to apply in the second dashboard , it didn't work. I'm not sure whether I need to change some settings at the appearance or other settings that I am not sure where. I appreciate if someone can help me.
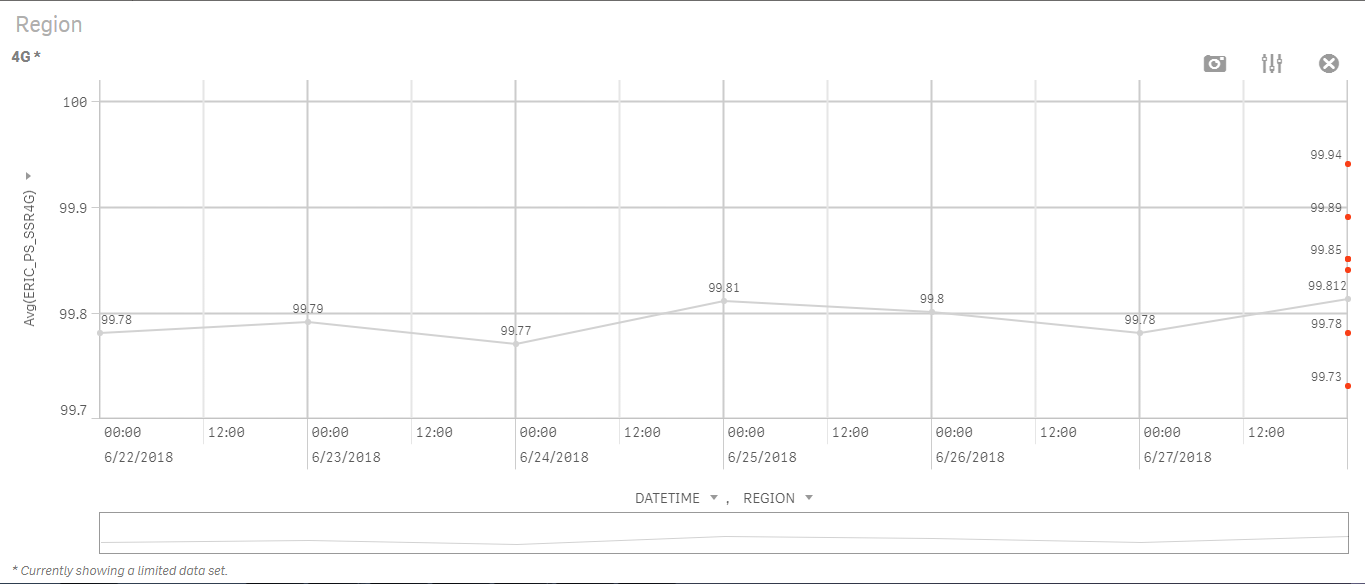
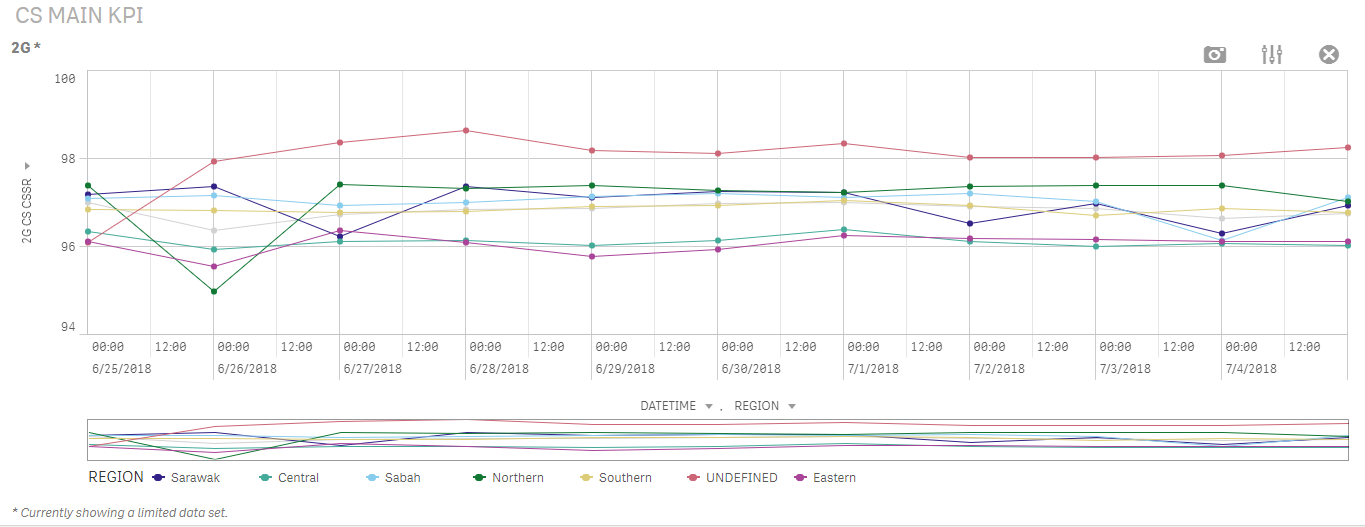
Figure 2
- Mark as New
- Bookmark
- Subscribe
- Mute
- Subscribe to RSS Feed
- Permalink
- Report Inappropriate Content
can you share your qliksense file with us?
- Mark as New
- Bookmark
- Subscribe
- Mute
- Subscribe to RSS Feed
- Permalink
- Report Inappropriate Content
HI , I've attached the files and the script that I have edited, hope you can help me.
- Mark as New
- Bookmark
- Subscribe
- Mute
- Subscribe to RSS Feed
- Permalink
- Report Inappropriate Content
Hi Mahirah,
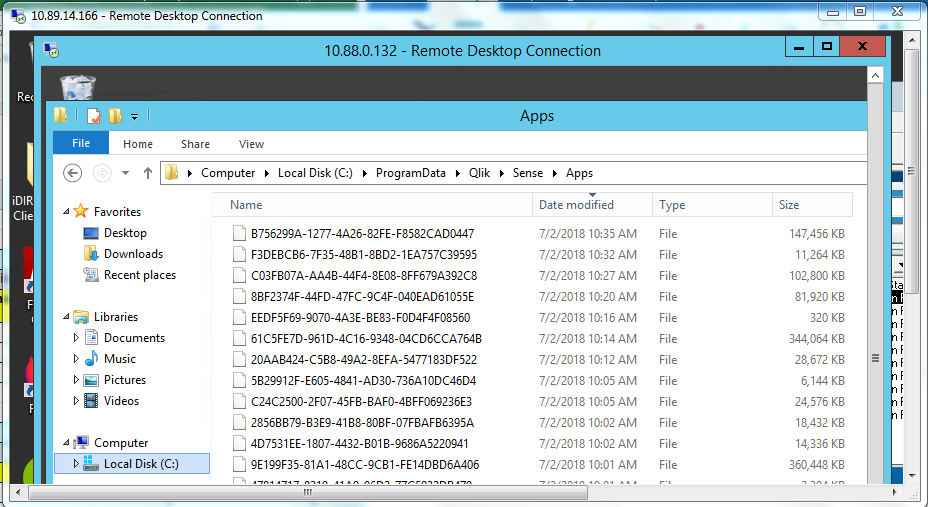
We need the QVF file too. it is in your document->Qlik->Sense->Apps.
Thanks.
- Mark as New
- Bookmark
- Subscribe
- Mute
- Subscribe to RSS Feed
- Permalink
- Report Inappropriate Content
Hi Albab,
Sorry but I'm quite new, the Qlik/Sense/apps, is it for the apps that has been published or not published?
I'm quite lost on finding my apps , cause there are few more apps that is not created by me
- Mark as New
- Bookmark
- Subscribe
- Mute
- Subscribe to RSS Feed
- Permalink
- Report Inappropriate Content
can you try go there? Document->Qlik->Sense->Apps
- Mark as New
- Bookmark
- Subscribe
- Mute
- Subscribe to RSS Feed
- Permalink
- Report Inappropriate Content
Hi Nur,
In app overview it shows the name of the file which you have opened. Please find and share that file with us then we can help you.
Thanks.
- Mark as New
- Bookmark
- Subscribe
- Mute
- Subscribe to RSS Feed
- Permalink
- Report Inappropriate Content
Hi All,
Sorry for the late reply. I have just understand that my data are specifically for one day data, hence there are no multiple lines in the chart. So I have gathered the weekly data and then there are multiple lines in the chart.
Regards and Thank you for helping.