Unlock a world of possibilities! Login now and discover the exclusive benefits awaiting you.
- Qlik Community
- :
- Forums
- :
- Analytics & AI
- :
- Products & Topics
- :
- App Development
- :
- Line Chart Limitations Not Working
- Subscribe to RSS Feed
- Mark Topic as New
- Mark Topic as Read
- Float this Topic for Current User
- Bookmark
- Subscribe
- Mute
- Printer Friendly Page
- Mark as New
- Bookmark
- Subscribe
- Mute
- Subscribe to RSS Feed
- Permalink
- Report Inappropriate Content
Line Chart Limitations Not Working
Hello,
I have a line chart and a straight table with the same dimensions and measure as follows.
Dimensions:
- Effective From Date (Primary Sort)
- Currency Code
Measure
- (Sum(bidRate) - Above(Total Sum(bidRate))) / Above(Total Sum(bidRate)) (Number format is %)
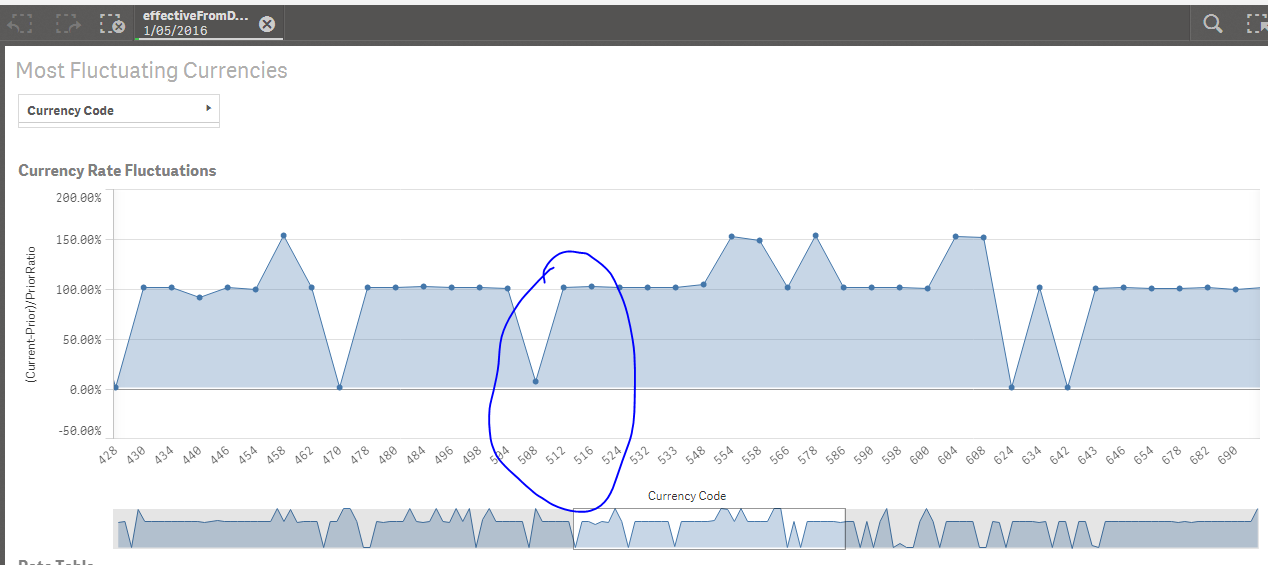
The issue is that the measure percentage calculates correctly in the straight table, but when I drill down to a specific Currency Code in the line chart, the value is completely wrong even though I am using the exact same measure expression as used in the straight table. Please see attached screen shots.
I am using Qlik Sense 2.2.
Has anyone experienced this issue?
Thank you!
- Tags:
- line graphs
- « Previous Replies
-
- 1
- 2
- Next Replies »
Accepted Solutions
- Mark as New
- Bookmark
- Subscribe
- Mute
- Subscribe to RSS Feed
- Permalink
- Report Inappropriate Content
Do you know if Qlik Sense allows for Conditional Hide/show of dimension? Reddys310 - Do you know? I have to Hide effectiveFromDate when GetSelectedCount(effectiveFromDate) = 1
- Mark as New
- Bookmark
- Subscribe
- Mute
- Subscribe to RSS Feed
- Permalink
- Report Inappropriate Content
You can get this right using the newly introduced Sorting within Aggr() functionality. The sortable Aggr function is finally here!
Might be able to help better if you can provide a sample
- Mark as New
- Bookmark
- Subscribe
- Mute
- Subscribe to RSS Feed
- Permalink
- Report Inappropriate Content
Hi Sunny,
I attached the qvf. It's a small app.
Thank you!
- Mark as New
- Bookmark
- Subscribe
- Mute
- Subscribe to RSS Feed
- Permalink
- Report Inappropriate Content
What selections have been made? I am unable to locate the incorrect peak
- Mark as New
- Bookmark
- Subscribe
- Mute
- Subscribe to RSS Feed
- Permalink
- Report Inappropriate Content
Stay on the first sheet, filter on effective from date of 1/05/2016. You'll see the first peak in the preview. That will be the 512 Currency Code. Ignore the second sheet.
Thanks,
- Mark as New
- Bookmark
- Subscribe
- Mute
- Subscribe to RSS Feed
- Permalink
- Report Inappropriate Content
With Date Selected the chart is working now. What would you want to see when no selection has been made?
- Mark as New
- Bookmark
- Subscribe
- Mute
- Subscribe to RSS Feed
- Permalink
- Report Inappropriate Content
Thanks Sunny!
When no filters are selected, I need to see the attached. The aggregated fluctuation per day. Then as I select specific days, the line chart should drill down to all of the Currency Codes for that selected day. Then if the day filter is removed, the remaining Currency Code filter should show the fluctuations across all of the days.
- Mark as New
- Bookmark
- Subscribe
- Mute
- Subscribe to RSS Feed
- Permalink
- Report Inappropriate Content
Do you know if Qlik Sense allows for Conditional Hide/show of dimension? Reddys310 - Do you know? I have to Hide effectiveFromDate when GetSelectedCount(effectiveFromDate) = 1
- Mark as New
- Bookmark
- Subscribe
- Mute
- Subscribe to RSS Feed
- Permalink
- Report Inappropriate Content
Currently, Qlik Sense does not allow Conditional Hide/Show of dimensions. I used what you sent back and altered the charts. I made a line chart with just the Effective From Date to show the total fluctuation per date and a separate line chart showing each Currency Code's fluctuation for the selected date. Works well.
As always, thanks for the help Sunny!!!
- Mark as New
- Bookmark
- Subscribe
- Mute
- Subscribe to RSS Feed
- Permalink
- Report Inappropriate Content
Awesome 
I wish there was a way to do it, but I am glad you were able to find a work around.
Best,
Sunny
- « Previous Replies
-
- 1
- 2
- Next Replies »