Unlock a world of possibilities! Login now and discover the exclusive benefits awaiting you.
- Qlik Community
- :
- Forums
- :
- Analytics & AI
- :
- Products & Topics
- :
- App Development
- :
- Re: Line graph zero values
- Subscribe to RSS Feed
- Mark Topic as New
- Mark Topic as Read
- Float this Topic for Current User
- Bookmark
- Subscribe
- Mute
- Printer Friendly Page
- Mark as New
- Bookmark
- Subscribe
- Mute
- Subscribe to RSS Feed
- Permalink
- Report Inappropriate Content
Line graph zero values
Hi,
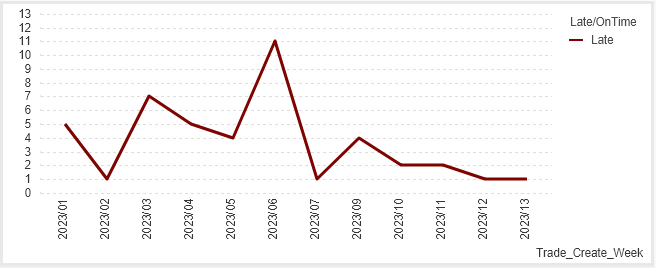
I have the below line graph and I would like to include data point as zero when there are no late trades. Currently weeks 8 and 14 are zero, however they don't appear on the graph.
Any help would be much appreciated.
Regards,
Daniel
- Mark as New
- Bookmark
- Subscribe
- Mute
- Subscribe to RSS Feed
- Permalink
- Report Inappropriate Content
@danielnevitt Make sure that Supress zero value option is enabled, If not try to enable that option. Still doesn't work then follow below approach after enabling suppress zero value option
add sum({1}0 ) to your measure for eg. if your line chart measure is "=Sum(Value)", you need to write measure as below
=Sum(Value) + sum({1}0)
- Mark as New
- Bookmark
- Subscribe
- Mute
- Subscribe to RSS Feed
- Permalink
- Report Inappropriate Content
Hi Kushal,
Thank you for your reply.
Unfortunately the graph now shows all data and ignores my expression:
Count(DISTINCT {<[Late/OnTime]={`Genuine Late`,`Late`}>}trade_num)+ sum({1}0)
Do you have any ideas how I can make the date continuous?
Thanks,
Daniel
- Mark as New
- Bookmark
- Subscribe
- Mute
- Subscribe to RSS Feed
- Permalink
- Report Inappropriate Content
@danielnevitt can you send screenshot of problem?
- Mark as New
- Bookmark
- Subscribe
- Mute
- Subscribe to RSS Feed
- Permalink
- Report Inappropriate Content
Do you have the week missing in your model ?