Unlock a world of possibilities! Login now and discover the exclusive benefits awaiting you.

- Qlik Community
- :
- Forums
- :
- Analytics & AI
- :
- Products & Topics
- :
- App Development
- :
- Linest Year vs MonthYear
- Subscribe to RSS Feed
- Mark Topic as New
- Mark Topic as Read
- Float this Topic for Current User
- Bookmark
- Subscribe
- Mute
- Printer Friendly Page

 jpapador
- Mark as New
- Bookmark
- Subscribe
- Mute
- Subscribe to RSS Feed
- Permalink
- Report Inappropriate Content
Linest Year vs MonthYear
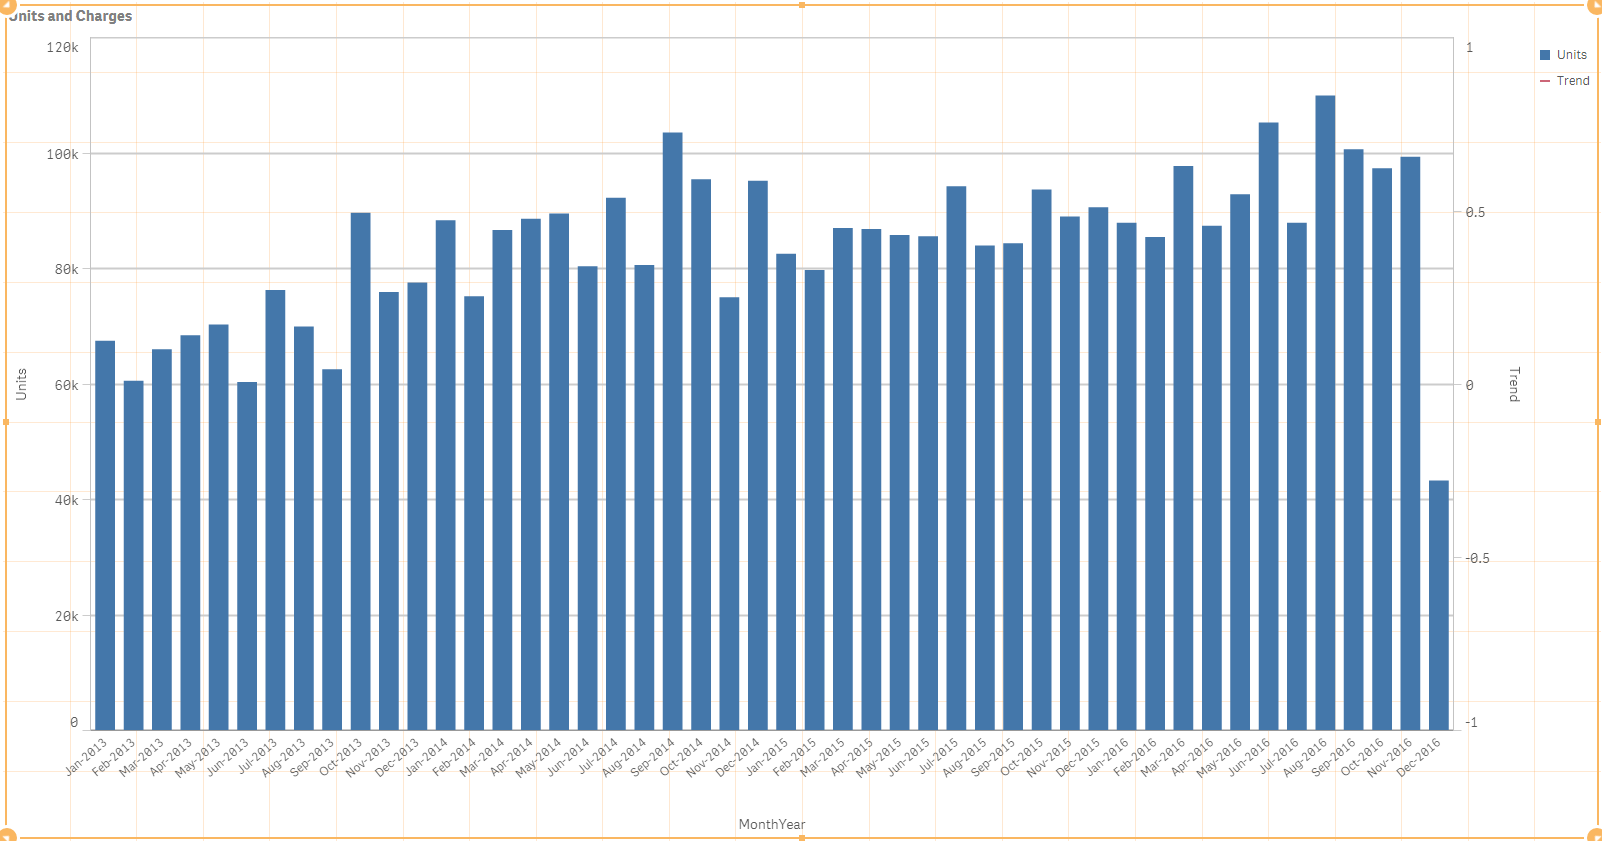
I have a bar chart that shows units by month year. I am trying to make a second expression that is a linear trend line. When I use the first expression (Year) it works but displays in the fashion shown in the year attachment.
When I try to use the Month Year expression it doesn't display anything (shown in MonthYear attachment). Any ideas?
I think I am missing something simple:
Year Screenshot expression
Linest_M(TOTAL Aggr(Sum(Units), Year), Year)
*
Only( Year)
+
Linest_B(TOTAL Aggr(Sum(Units), Year), Year)
MonthYear Screenshot Expression
Linest_M(TOTAL Aggr(Sum(Units), MonthYear), MonthYear)
*
Only( MonthYear)
+
Linest_B(TOTAL Aggr(Sum(Units), MonthYear), MonthYear)


 vinieme12
- Mark as New
- Bookmark
- Subscribe
- Mute
- Subscribe to RSS Feed
- Permalink
- Report Inappropriate Content
if you want a trendline for each MonthYear, why not just add SUM(Amount) as line? you already have MonthYEar as dimension?
If a post helps to resolve your issue, please accept it as a Solution.
jpapador
- Mark as New
- Bookmark
- Subscribe
- Mute
- Subscribe to RSS Feed
- Permalink
- Report Inappropriate Content
Sum(Amount) is the expression that produces the blue bars. Sum(Amount) just gives you the sum by month, not a linear trend line.
