Unlock a world of possibilities! Login now and discover the exclusive benefits awaiting you.

- Qlik Community
- :
- Forums
- :
- Analytics & AI
- :
- Products & Topics
- :
- App Development
- :
- Percentage in stack bar with MTD & YTD Dimension
- Subscribe to RSS Feed
- Mark Topic as New
- Mark Topic as Read
- Float this Topic for Current User
- Bookmark
- Subscribe
- Mute
- Printer Friendly Page

 daisy
daisy
- Mark as New
- Bookmark
- Subscribe
- Mute
- Subscribe to RSS Feed
- Permalink
- Report Inappropriate Content
Percentage in stack bar with MTD & YTD Dimension
Hello Everyone:
I have a 2 Financial Year data pool like below:( DR Result only have 4 figures :1,2,3,4)
| No | PGI Date | Financial Year | Period | DR Result |
| 1 | 10/31/2019 | FY20 | P1 | 1 |
| 2 | 9/26/2020 | FY20 | P12 | 2 |
| 3 | 10/15/2020 | FY21 | P1 | 1 |
| 4 | 11/10/2020 | FY21 | P2 | 3 |
| 5 | 12/9/2020 | FY21 | P3 | 2 |
| 6 | 12/29/2020 | FY21 | P3 | 4 |
I want to create a percentage stack bar with MTD & YTD Dimension like below:
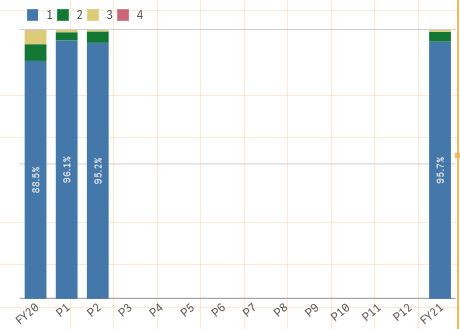
Current Situation:
Now I use valuelist as the dimension, but it's vvvvvvery complex!
Dimension: =ValueList('FY20','P1','P2','P3','P4','P5','P6','P7','P8','P9','P10','P11','P12','FY21')
Measure: there's 4 measures all use pick(match(valuelist()),,count({<DR Result={'1'}>})/count()), which will write a lot of rows!!!
My Target:
I read a post : https://community.qlik.com/t5/Qlik-Sense-App-Development/Percentage-display-on-a-Stacked-Bar-Chart/t... , so I try to revise my function, but I only can write MTD, without YTD
Dimension1: Period
Dimension2: DR Result
Measure: count({<FY={'FY21'}>}[DR Result])/sum(total <Period> aggr(count({<FY={'FY21'}>}[DR Result]),Period,[DR Result]))
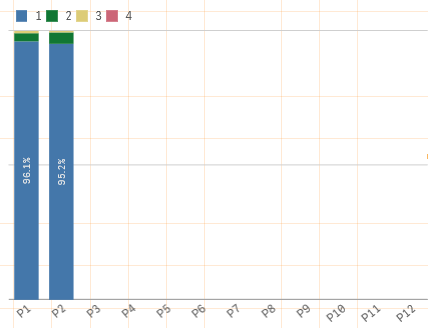
So my question is that is there a way to make it easier to show the percentage stack bar with MTD & YTD in the dimension?
Thanks so much in advance!
