Unlock a world of possibilities! Login now and discover the exclusive benefits awaiting you.

- Qlik Community
- :
- Forums
- :
- Analytics & AI
- :
- Products & Topics
- :
- App Development
- :
- Problem with stacked chart
- Subscribe to RSS Feed
- Mark Topic as New
- Mark Topic as Read
- Float this Topic for Current User
- Bookmark
- Subscribe
- Mute
- Printer Friendly Page

 gladi-cz
- Mark as New
- Bookmark
- Subscribe
- Mute
- Subscribe to RSS Feed
- Permalink
- Report Inappropriate Content
Problem with stacked chart
Hello guys,
i have this issue with stacked chart in Qlik Sense.
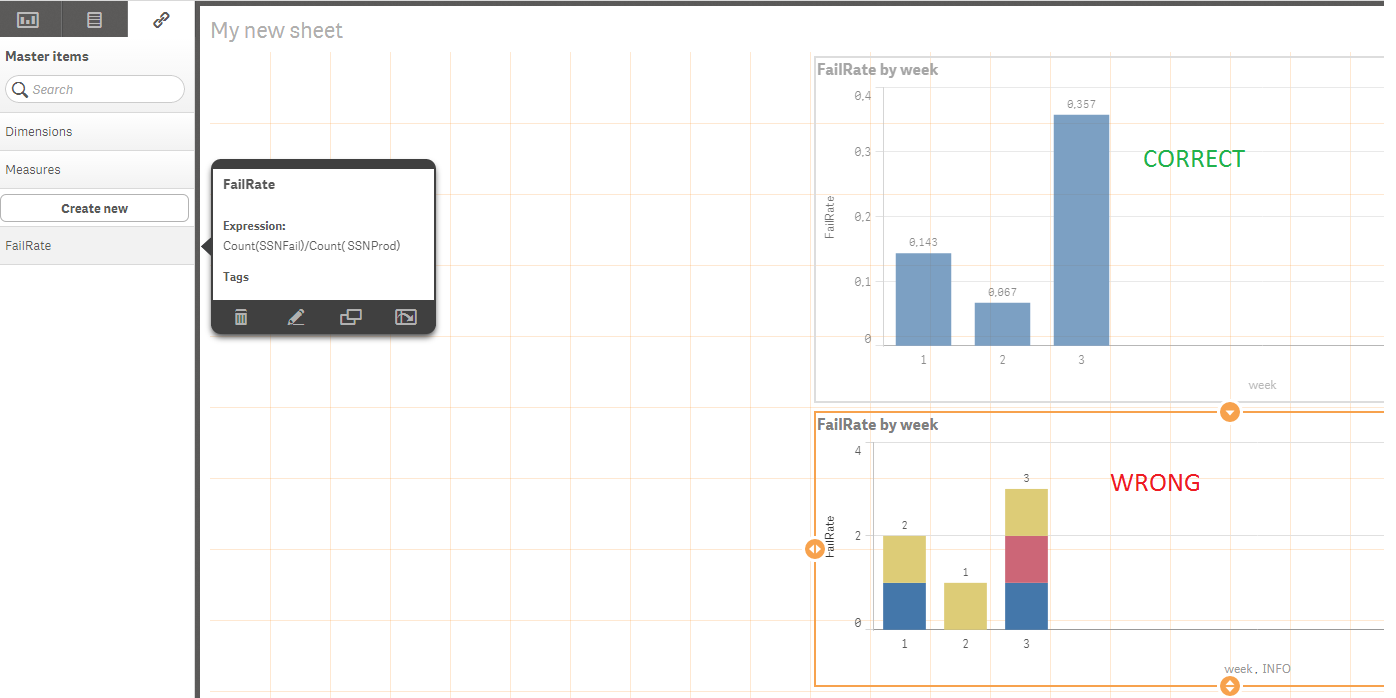
First chart gives information about failrate by week - there isnt any problem.
Second chart gives same information with detail informations about fails.. - there is problem with bad results. For example on week 3 is result 3 -> 0.357 is a right result(0.119 for each part). Where is a problem? When i use TOTAL in measure, then result is still bad.
+QVF attach.
Please, could you help me?
Thanks, Petr.
- Tags:
- barchart stacked

- Mark as New
- Bookmark
- Subscribe
- Mute
- Subscribe to RSS Feed
- Permalink
- Report Inappropriate Content
It looks like you are using COUNT in your expression, so it is displaying the number of values rather than the SUM.
gladi-cz
- Mark as New
- Bookmark
- Subscribe
- Mute
- Subscribe to RSS Feed
- Permalink
- Report Inappropriate Content
Yes, Dan. I used count, because i count string values - serial numbers (czc01a,czc02a,czc03a...). By the way, measures are same in both charts, but results are different