Unlock a world of possibilities! Login now and discover the exclusive benefits awaiting you.
- Qlik Community
- :
- Forums
- :
- Analytics & AI
- :
- Products & Topics
- :
- App Development
- :
- Problem with trend line
- Subscribe to RSS Feed
- Mark Topic as New
- Mark Topic as Read
- Float this Topic for Current User
- Bookmark
- Subscribe
- Mute
- Printer Friendly Page
- Mark as New
- Bookmark
- Subscribe
- Mute
- Subscribe to RSS Feed
- Permalink
- Report Inappropriate Content
Problem with trend line
Hi,
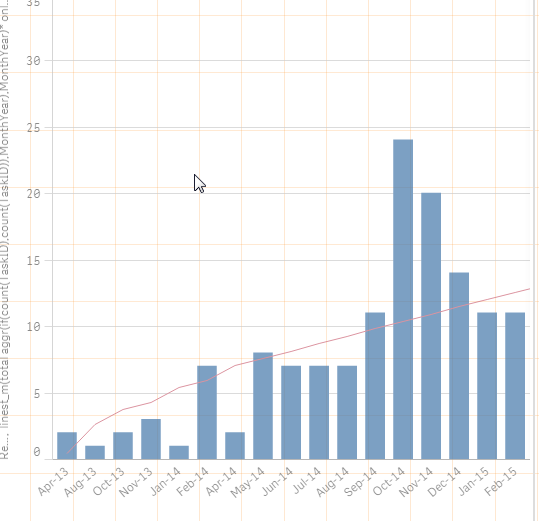
I'm trying to add a trend line to a pretty simple bar chart but I'm having trouble with the linest function giving back data. I've looked over all the examples of this and can't figure out where I've got it wrong. My input data is just two columns, a task-id and and open date. I'm charting the number of tasks per month and I'd like a trend line. To do that I'm using the Linest_M, Linest_B example posted by Mike Tarallo from here: https://community.qlik.com/message/589715?&_ga=1.178503972.1681760603.1478098016#589715
The problem I'm having is that I can't even get information out for the Linest_M function. My function looks like this:
LINEST_M(Total aggr(Distinct Count(TaskID),(Date(monthstart(OpenDate), 'MMM-YY')),(Date(monthstart(OpenDate), 'MMM-YY'))),(Date(monthstart(OpenDate), 'MMM-YY')))
App is attached for reference. Thanks in advance for any help.
Accepted Solutions
- Mark as New
- Bookmark
- Subscribe
- Mute
- Subscribe to RSS Feed
- Permalink
- Report Inappropriate Content
I simplified the expression by changing your loadscript to simply create a field as part of the load that was your Month and Year.
[Sheet1-1]:
LOAD
OpenDate,
Date(monthstart(OpenDate), 'MMM-YY') as MonthYear,
TaskID
FROM [lib://Queries/CallData.xlsx] (ooxml, embedded labels, table is Sheet1);
Then your chart expression is a little simpler to follow:
linest_m(total aggr(if(count(TaskID),count(TaskID)),MonthYear),MonthYear)*
only({1}MonthYear)+linest_b(total aggr(if(count(TaskID),count(TaskID)),MonthYear),MonthYear)
I've attached my modified version of your application.
Hope this helps. For anyone reading the formula and asking "what in the world is that AGGR stuff" ... be sure to watch this recorded webinar that explains the AGGR function in detail. http://event.on24.com/wcc/r/1282824/3F17A1A59D58CCBE5B9A246A6208176B it includes beginning and intermediate content from me, and advanced content by troyansky
- Mark as New
- Bookmark
- Subscribe
- Mute
- Subscribe to RSS Feed
- Permalink
- Report Inappropriate Content
Thank you very much Dalton! This is great!