Unlock a world of possibilities! Login now and discover the exclusive benefits awaiting you.
- Qlik Community
- :
- Forums
- :
- Analytics & AI
- :
- Products & Topics
- :
- App Development
- :
- QS. Combo chart. Secondary axis for bar
- Subscribe to RSS Feed
- Mark Topic as New
- Mark Topic as Read
- Float this Topic for Current User
- Bookmark
- Subscribe
- Mute
- Printer Friendly Page
- Mark as New
- Bookmark
- Subscribe
- Mute
- Subscribe to RSS Feed
- Permalink
- Report Inappropriate Content
QS. Combo chart. Secondary axis for bar
Hello everybody!
I want to show the sales increase like a bar and on the secondary axis
Can I do this? Is it possible?
Now I have the next situation
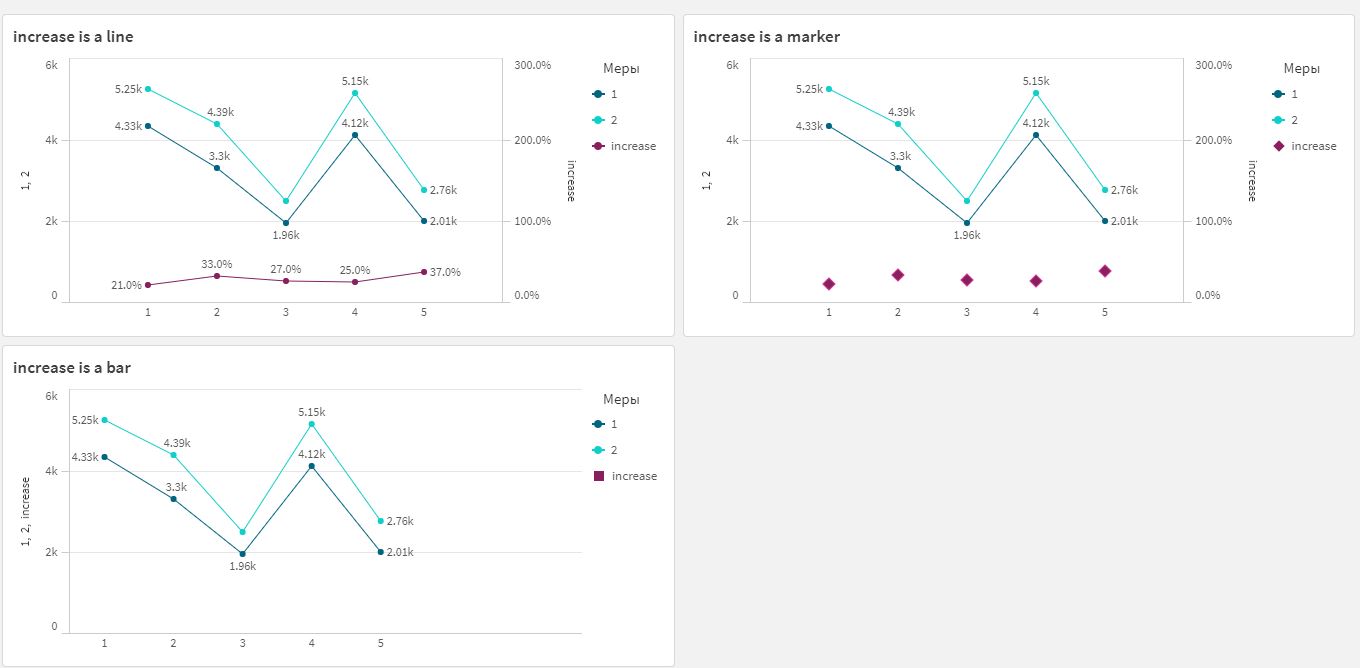
if the increase is a line - everything is ok
if the increase is a marker - it is displayed on the secondary axis but without value labels/markers
if the increase is a bar - it is not displayed at all because it is too small to be displayed on the primary axis but the secondary axis cannot be selected
load * inline
[
year ,month ,sales
1 ,1 ,4334
1 ,2 ,3303
1 ,3 ,1956
1 ,4 ,4123
1 ,5 ,2015
2 ,1 ,5245
2 ,2 ,4393
2 ,3 ,2485
2 ,4 ,5154
2 ,5 ,2761
]
;
- Tags:
- combo chart
Accepted Solutions
- Mark as New
- Bookmark
- Subscribe
- Mute
- Subscribe to RSS Feed
- Permalink
- Report Inappropriate Content
- Mark as New
- Bookmark
- Subscribe
- Mute
- Subscribe to RSS Feed
- Permalink
- Report Inappropriate Content
Thank
I just made the sale on the secondary axis and the increase on the primary
and it is works
it may not be possible to make bars on the secondary axis

- Mark as New
- Bookmark
- Subscribe
- Mute
- Subscribe to RSS Feed
- Permalink
- Report Inappropriate Content

- Mark as New
- Bookmark
- Subscribe
- Mute
- Subscribe to RSS Feed
- Permalink
- Report Inappropriate Content
hi,
you have to set Minmum 0 and Maximum 100% in sales trend chart in appearance setting ,
then sales trend become big,
ksrinivasan
- Mark as New
- Bookmark
- Subscribe
- Mute
- Subscribe to RSS Feed
- Permalink
- Report Inappropriate Content
Thank you for your advice))
But I need 2 line (sales) in thousands and 1 bar (increase) in %
QS has no "Split axis", so a secondary axis is needed here
For example this is what I want (QV)

- Mark as New
- Bookmark
- Subscribe
- Mute
- Subscribe to RSS Feed
- Permalink
- Report Inappropriate Content
- Mark as New
- Bookmark
- Subscribe
- Mute
- Subscribe to RSS Feed
- Permalink
- Report Inappropriate Content
https://community.qlik.com/t5/New-to-QlikView/set-secondary-axis-in-a-chart/m-p/1026810
It is QV
In QV I show the example
Need the same thing in QS ^-^
- Mark as New
- Bookmark
- Subscribe
- Mute
- Subscribe to RSS Feed
- Permalink
- Report Inappropriate Content
hi,
i am sry,
please refer below:

ksrinivasan
- Mark as New
- Bookmark
- Subscribe
- Mute
- Subscribe to RSS Feed
- Permalink
- Report Inappropriate Content
- Mark as New
- Bookmark
- Subscribe
- Mute
- Subscribe to RSS Feed
- Permalink
- Report Inappropriate Content
Thank
I just made the sale on the secondary axis and the increase on the primary
and it is works
it may not be possible to make bars on the secondary axis