Unlock a world of possibilities! Login now and discover the exclusive benefits awaiting you.

Announcements
Share your agentic AI experience, learn from others, and earn a new badge: Put Agentic AI to Work
- Qlik Community
- :
- Forums
- :
- Analytics & AI
- :
- Products & Topics
- :
- App Development
- :
- Qlik NPrinting - Pixel Perfect chart series bindin...
Options
- Subscribe to RSS Feed
- Mark Topic as New
- Mark Topic as Read
- Float this Topic for Current User
- Bookmark
- Subscribe
- Mute
- Printer Friendly Page
Turn on suggestions
Auto-suggest helps you quickly narrow down your search results by suggesting possible matches as you type.
Showing results for

 luigibrancati
Contributor II
2021-02-01
10:26 AM
- Mark as New
- Bookmark
- Subscribe
- Mute
- Subscribe to RSS Feed
- Permalink
- Report Inappropriate Content
Qlik NPrinting - Pixel Perfect chart series binding
I'm having some issues while trying to create a reporting document for a QlikSense App using Qlik Nprinting November 2020 with Pixel Perfect.
In particular, I want to create a very simple Pie Chart based off a table in QlikSense. The table is as simple as this:
| Impact | Number_Impact |
| 1 - Low | 12 |
| 2 - Medium | 11 |
| 3 - High | 2 |
| 4 - Critical | 3 |
The problem is that I want to represent this as a Pie Chart. I tried two ways:
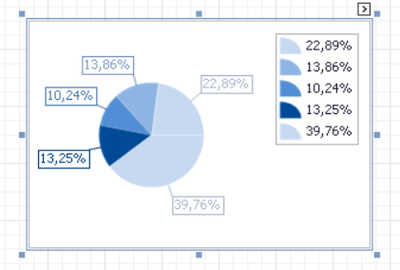
- I created a series with Impact as argument and Number_Impact as value, this is the result:
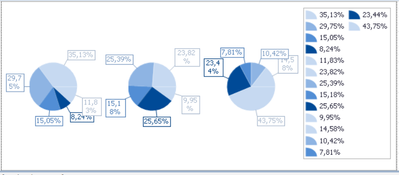
- Then I tried using the Auto-created series, using Impact in the fields Series and Argument, and Number_Impact in the field Value, but got an even worse result:
I found absolutely nothing online that might have helped me to solve this issue. To be honest, I'm astonished this tool has such a poor and lacking documentation. How does the Auto-created series even work? There's 0 info on the internet.
629 Views
0 Replies
