Unlock a world of possibilities! Login now and discover the exclusive benefits awaiting you.
- Qlik Community
- :
- Forums
- :
- Analytics & AI
- :
- Products & Topics
- :
- App Development
- :
- Qlik Sense - Create a "path map" inside a image
- Subscribe to RSS Feed
- Mark Topic as New
- Mark Topic as Read
- Float this Topic for Current User
- Bookmark
- Subscribe
- Mute
- Printer Friendly Page
- Mark as New
- Bookmark
- Subscribe
- Mute
- Subscribe to RSS Feed
- Permalink
- Report Inappropriate Content
Qlik Sense - Create a "path map" inside a image
Hi experts,
I've a database with the personal data of the football team and I'm trying to create a specific dashboard to this topic .
What I want to create is the composition of the team over a picture of a football field. Basically, if a assign some values to each player to used them in a Scatter Chart, I think I can't obtain the chart I want.
Just as there is a Google Maps API , I enjoyed over an image of a field create the " path " of the starting lineup of the team.
Below follows the attached image I'm trying to create.
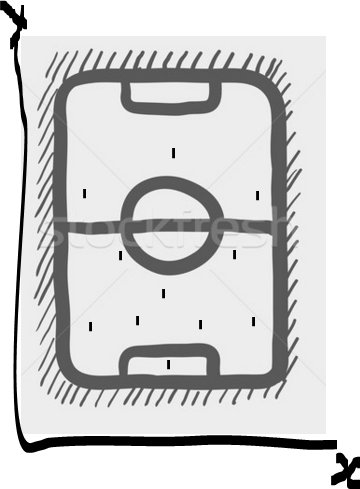
I think that the way would be with a scatter chart.
If you see I'm need to have some values to x-scale and y-scale to put the players where I want. My problem is to align the chart with the image. Does anyone have any better idea to do this?
So many thanks! 