Unlock a world of possibilities! Login now and discover the exclusive benefits awaiting you.
- Qlik Community
- :
- Forums
- :
- Analytics & AI
- :
- Products & Topics
- :
- App Development
- :
- Qlik Sense, plot total average and distinct values...
- Subscribe to RSS Feed
- Mark Topic as New
- Mark Topic as Read
- Float this Topic for Current User
- Bookmark
- Subscribe
- Mute
- Printer Friendly Page
- Mark as New
- Bookmark
- Subscribe
- Mute
- Subscribe to RSS Feed
- Permalink
- Report Inappropriate Content
Qlik Sense, plot total average and distinct values at the same time
Hi Community,
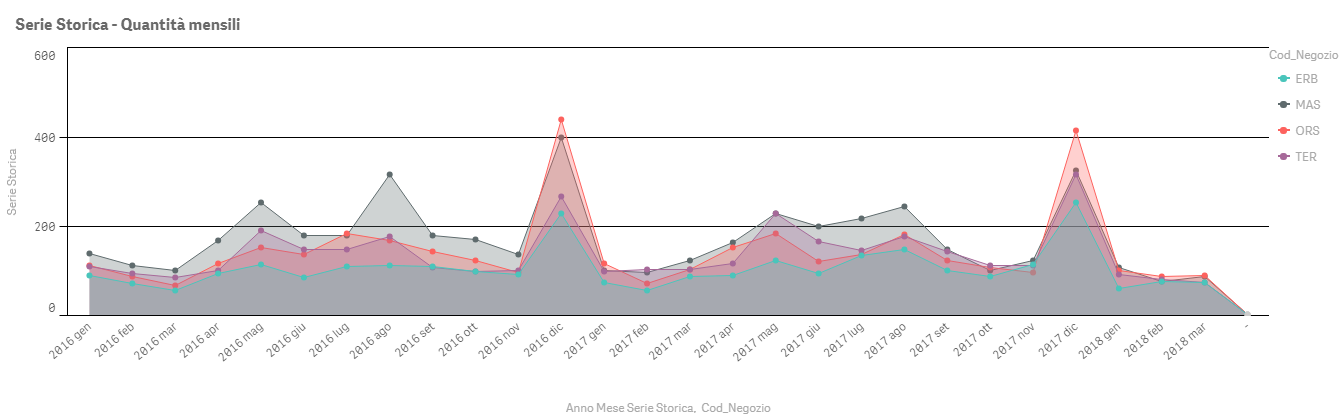
I'm trying to plot in line, bar or combo chart my data with:
- 2 dimensions
- Date, expressed in Year Month
- Store, expressed as a string that show the store's name
- 1 measure: sum of sales (in quantity)
I would like to plot on the same chart the average of sales by date of all the stores (or the average of the selected stores), at the same time with my distinct stores.
My target is to create a visualization that lets my user to visualize the difference between the total average and the single stores.
Here is a snapshot of my line chart.
Thanks in advance for any suggestion and precious help. Best regards.
- Federico Rizzello
- Tags:
- average of
- charts
- Mark as New
- Bookmark
- Subscribe
- Mute
- Subscribe to RSS Feed
- Permalink
- Report Inappropriate Content
Default chart visualization can have multiple dimension OR multiple measures.
- Mark as New
- Bookmark
- Subscribe
- Mute
- Subscribe to RSS Feed
- Permalink
- Report Inappropriate Content
Thanks for your reply.
I get your suggestion, but I don't know how to add a second measure (e.g. the overall average) while I already have two dimensions (Dates, Stores) on my chart.
- Mark as New
- Bookmark
- Subscribe
- Mute
- Subscribe to RSS Feed
- Permalink
- Report Inappropriate Content
Hello Federico,
this is not a nice solution but I think it can work for your case.
Create a fake dimension called for example "Cod_Negozio_New" in the following way:
LOAD DISTINCT Cod_Negozio, Cod_Negozio AS Cod_Negozio_New resident "your transaction table"
Concatenate
LOAD DISTINCT Cod_Negozio, 'Average' AS Cod_Negozio_New resident "your transaction table"
In this way your new store dimension will contain a new value 'Average' associated with all your original stores.
Then in graph use "Cod_Negozio_New" instead of "Cod_Negozio" and in the expression write something like this: IF(Cod_Negozio_New = 'Average', AVG(Sales), SUM(Sales)).
Hope this helps.
Regards