Unlock a world of possibilities! Login now and discover the exclusive benefits awaiting you.

Announcements
Share your agentic AI experience, learn from others, and earn a new badge: Put Agentic AI to Work
- Qlik Community
- :
- Forums
- :
- Analytics & AI
- :
- Products & Topics
- :
- App Development
- :
- Qliksense Scatter Plot
Options
- Subscribe to RSS Feed
- Mark Topic as New
- Mark Topic as Read
- Float this Topic for Current User
- Bookmark
- Subscribe
- Mute
- Printer Friendly Page
Turn on suggestions
Auto-suggest helps you quickly narrow down your search results by suggesting possible matches as you type.
Showing results for

 Nishadvel
Contributor II
2019-11-15
07:51 AM
- Mark as New
- Bookmark
- Subscribe
- Mute
- Subscribe to RSS Feed
- Permalink
- Report Inappropriate Content
Qliksense Scatter Plot
How to get this output in below mention chart
1 Solution
Accepted Solutions

 Stoyan_Terziev
Partner - Creator III
2019-11-15
08:56 AM
- Mark as New
- Bookmark
- Subscribe
- Mute
- Subscribe to RSS Feed
- Permalink
- Report Inappropriate Content
Hello Nish,
That's a combination between back-end and front-end trick you wanna do.
Attached is the QVF with back-end data in the format needed.
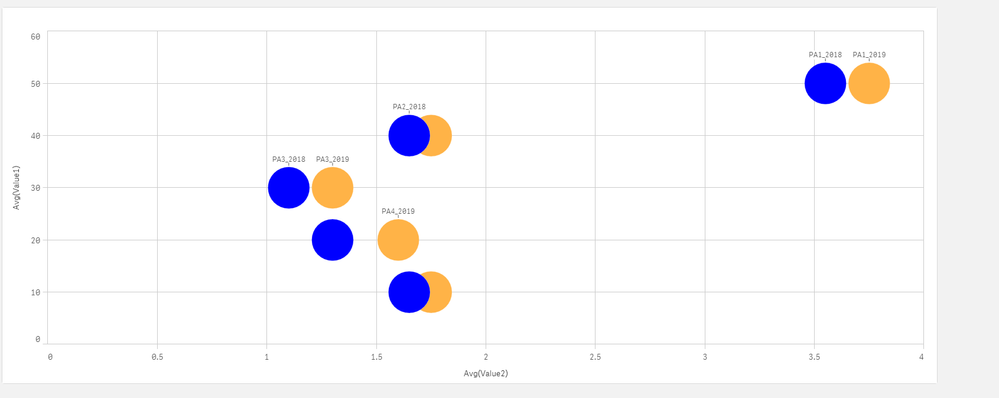
Result:

3 Replies
Stoyan_Terziev
Partner - Creator III
2019-11-15
08:56 AM
- Mark as New
- Bookmark
- Subscribe
- Mute
- Subscribe to RSS Feed
- Permalink
- Report Inappropriate Content
Hello Nish,
That's a combination between back-end and front-end trick you wanna do.
Attached is the QVF with back-end data in the format needed.
Result:
Nishadvel
Contributor II
2019-11-18
07:31 AM
Author
- Mark as New
- Bookmark
- Subscribe
- Mute
- Subscribe to RSS Feed
- Permalink
- Report Inappropriate Content
Thank You Lot....
1,854 Views
 Yogesh2020
Partner - Contributor II
2020-12-21
09:40 AM
- Mark as New
- Bookmark
- Subscribe
- Mute
- Subscribe to RSS Feed
- Permalink
- Report Inappropriate Content
When we do color by expression, the legend won't show. How can we add legend with specific fixed colors to data as well ?
1,738 Views
