Unlock a world of possibilities! Login now and discover the exclusive benefits awaiting you.
Announcements
Talend Cloud AWS EU Scheduled Outage: Starting Tues 26 May 21:00 CEST with expected completion Wed 27 May 01:00 CEST
- Qlik Community
- :
- Forums
- :
- Analytics & AI
- :
- Products & Topics
- :
- App Development
- :
- Qliksense Story Export Bug
Options
- Subscribe to RSS Feed
- Mark Topic as New
- Mark Topic as Read
- Float this Topic for Current User
- Bookmark
- Subscribe
- Mute
- Printer Friendly Page
Turn on suggestions
Auto-suggest helps you quickly narrow down your search results by suggesting possible matches as you type.
Showing results for
Partner - Contributor III
2016-08-18
09:17 AM
- Mark as New
- Bookmark
- Subscribe
- Mute
- Subscribe to RSS Feed
- Permalink
- Report Inappropriate Content
Qliksense Story Export Bug
Hi Exports,
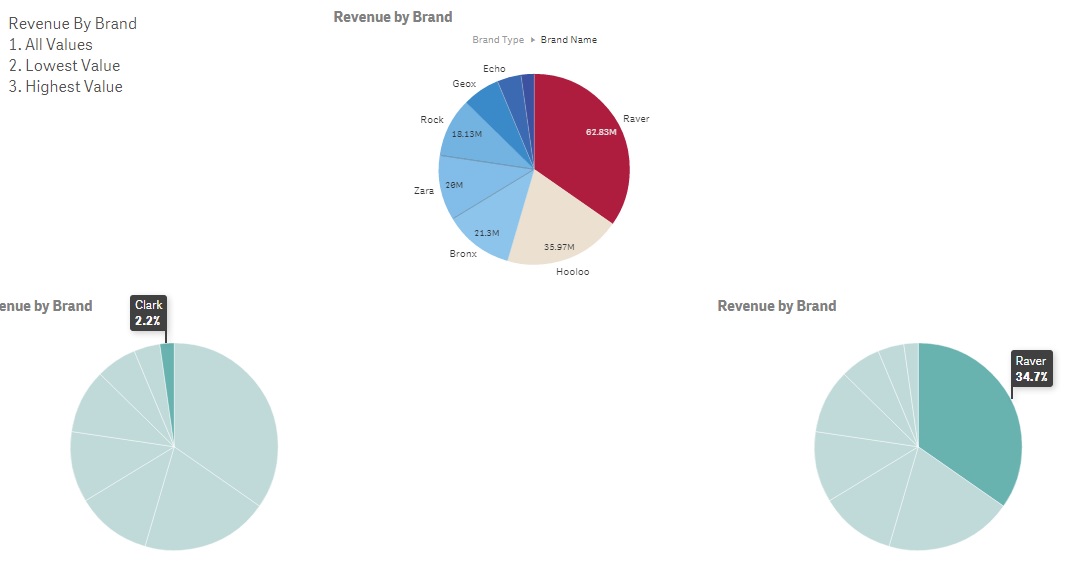
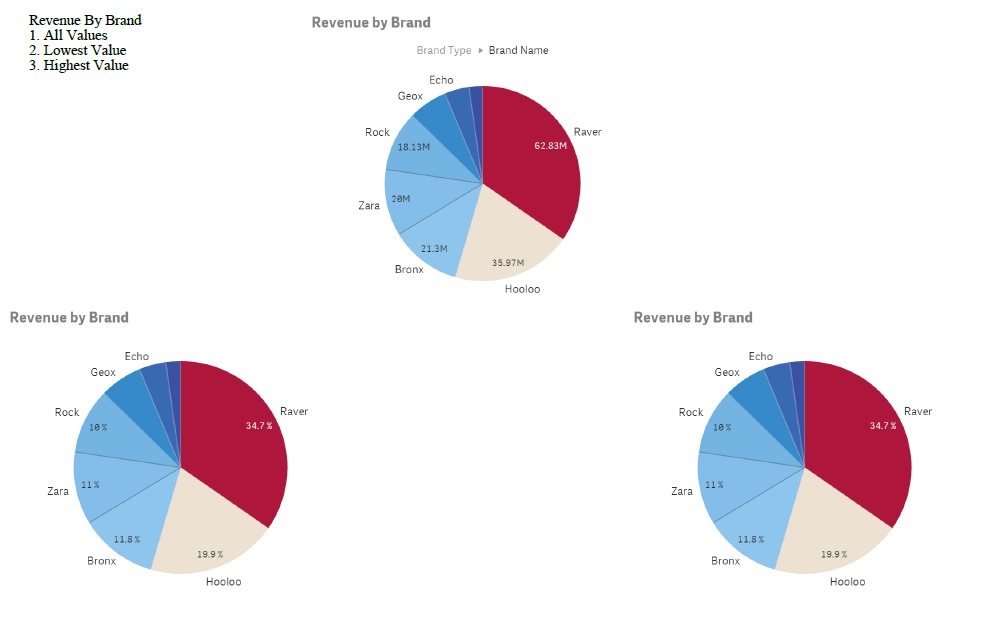
I created a Story with Pie Chart and Line Chart showing Lowest and Highest Values. I then Exported it to Power Point. But Power Point resets the Highest Value/Lowest Value and shows a regular chart.
I tried the same with Export to PDF and the Lowest and Highest Values are reset to show a regular chart.
Below is as shown in the Story:
Below is shown after export to PDF or Power Point:
Please let me know if I should be posting bugs elsewhere.
Thank you,
Paul
804 Views
0 Replies