Unlock a world of possibilities! Login now and discover the exclusive benefits awaiting you.
- Qlik Community
- :
- Forums
- :
- Analytics & AI
- :
- Products & Topics
- :
- App Development
- :
- Re: Range filter
- Subscribe to RSS Feed
- Mark Topic as New
- Mark Topic as Read
- Float this Topic for Current User
- Bookmark
- Subscribe
- Mute
- Printer Friendly Page
- Mark as New
- Bookmark
- Subscribe
- Mute
- Subscribe to RSS Feed
- Permalink
- Report Inappropriate Content
Range filter
isn't there any other way to just give simple range filters where user has option of > and < operator or can have between clause, in simple words just a ranged filter.
This functionality is so much easier in tableau and power hence in qlik sense i haven't came across one fully functional solution.
my solution :
made 2 Variable :
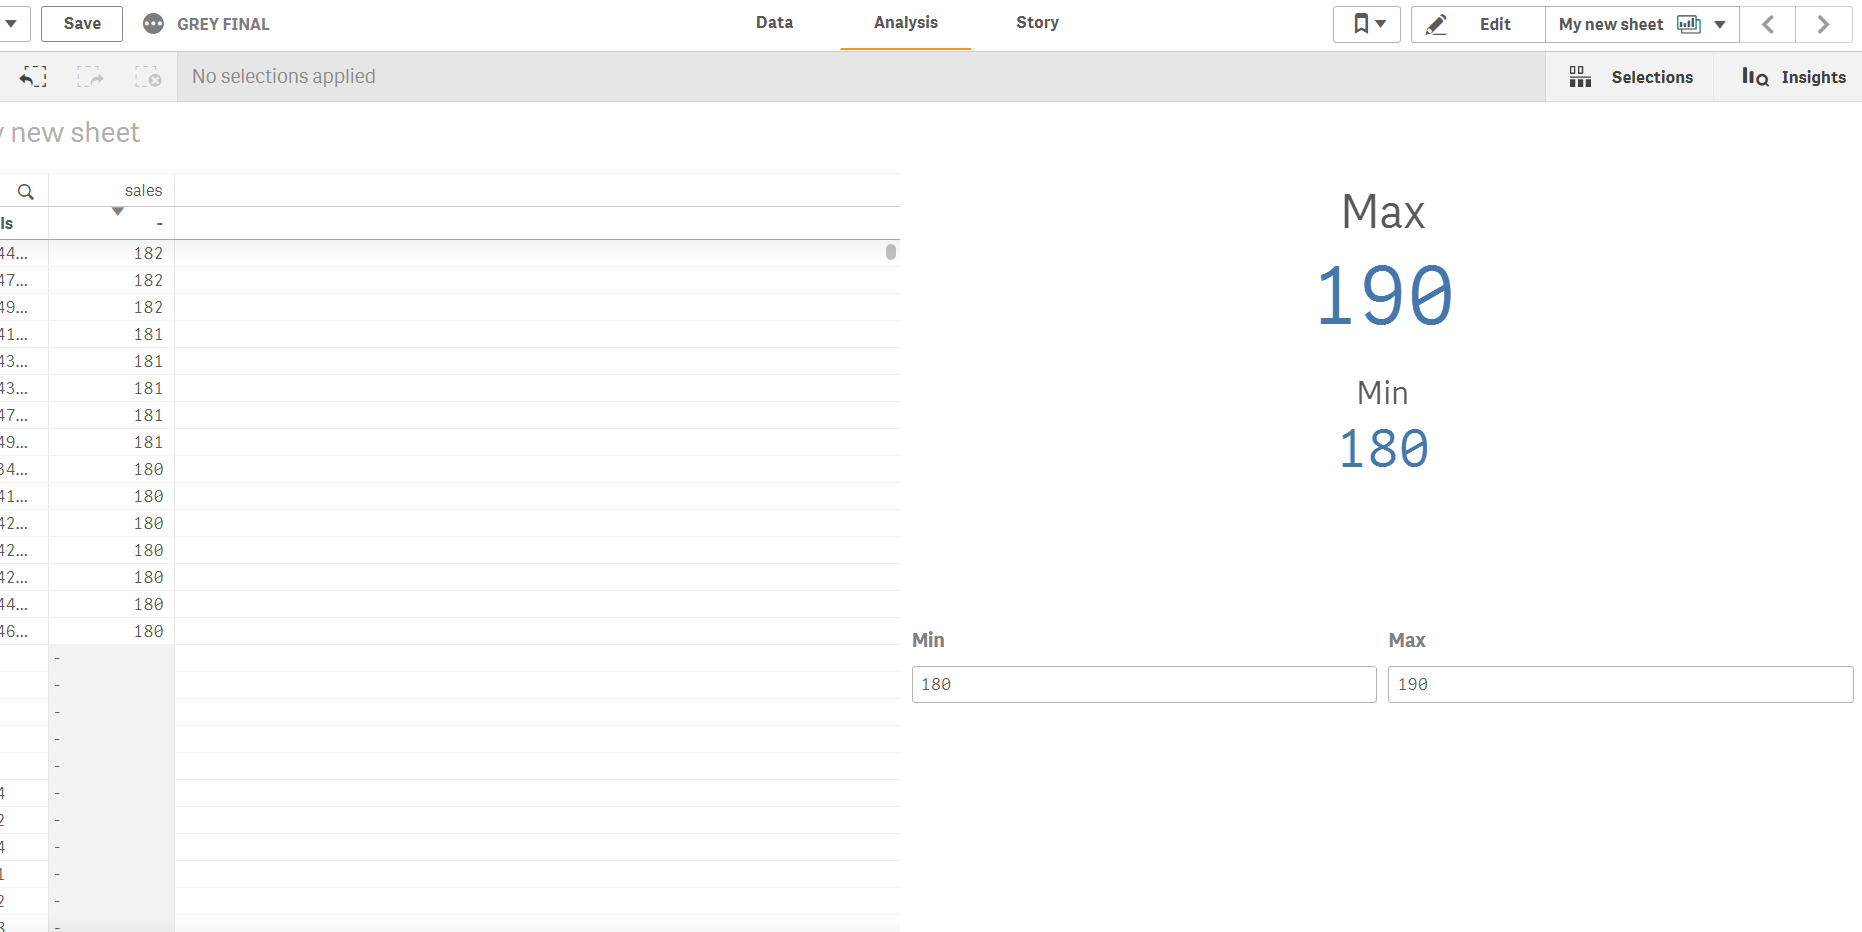
vMax =max(sales)
vMin=max(sales)
then use above variables in sales measure like this :
= if((sum(Sales) >= $(vMin) AND sum(Sales) <= $(vMax)),sum(TotalCalls))
which gives me following output in screenshot no 5 filtering the data but leaving blank in sales column where condition not met:
please help
- Tags:
- aggr()
- bar chart
- bug
- color
- combo chart
- count
- dimensions
- error
- extension
- kpi
- line chart
- map
- null
- pivot
- qlik sense
- qlik sense desktop
- Subscribe by Topic:
-
Data Model
-
filter
-
General Question
-
Script and Expressions
-
Visualization
Accepted Solutions
- Mark as New
- Bookmark
- Subscribe
- Mute
- Subscribe to RSS Feed
- Permalink
- Report Inappropriate Content
You can suppress those rows by going into the following properties: Add-ons -> Data handling -> Uncheck 'Include zero values'.
For the total, you can just change your expression to
Sum(Aggr(
  If((Sum(Sales) >= $(vMin) and Sum(Sales) <= $(vMax)), Sum(TotalCalls))
, YourDimensionsFromTheChart))
- Mark as New
- Bookmark
- Subscribe
- Mute
- Subscribe to RSS Feed
- Permalink
- Report Inappropriate Content
my dimension has millions of distinct values which is actually customer no , can you guide in this matter secondly how can i apply the selection made from my range filter to other sheets.
note : i have made multiple range filters.
- Mark as New
- Bookmark
- Subscribe
- Mute
- Subscribe to RSS Feed
- Permalink
- Report Inappropriate Content
I am not sure I understand the issue? "my dimension has millions of distinct values which is actually customer no" What does that have to do with the solution provided.
For the second condition... what exactly are you trying to do. Again, I am not really sure about the selections you are looking to have dashboard wide?
- Mark as New
- Bookmark
- Subscribe
- Mute
- Subscribe to RSS Feed
- Permalink
- Report Inappropriate Content
hi,
below is what i'm trying to do, creating normal filters and range filters for columns having alot of distinct values .
Requirement : using multiple filters lock the customers on certain criteria eg :
customer having sales > 5000 and qnty < 50 and profit between 200 and 1000
then show count(Distinct customers) with other dimensions.
after this sheet will be individual customer level sheet showing each customer who fulfilled above eg. criteria with some other kpis.
Issues :
1)filters should be applied per customer
2)totals should also change
3)dependencies between normal filter and range filters and with themselves too.
4) selection done in ranged filters don't get refreshed plus they don't show up in top selected tab too which makes it difficult to under which filter is applied which is not.
logic used in columns :
created two variables min and max then applied below expression in table columns :
= if((sum(Tax) >= $(vMinTax) AND sum(Tax) <= $(vMaxTax)),
if(isnull(sum(Tax)),null(),sum(Tax))
,null()
)

- Mark as New
- Bookmark
- Subscribe
- Mute
- Subscribe to RSS Feed
- Permalink
- Report Inappropriate Content
Hi, I have multiple sheets with different KPIs and tables, how can I make the range filter selection apply to all of them? Do I need to specify such an expression for every single chart and custom objects I have used?