Unlock a world of possibilities! Login now and discover the exclusive benefits awaiting you.
- Qlik Community
- :
- Forums
- :
- Analytics & AI
- :
- Products & Topics
- :
- App Development
- :
- Restricting to first visit
- Subscribe to RSS Feed
- Mark Topic as New
- Mark Topic as Read
- Float this Topic for Current User
- Bookmark
- Subscribe
- Mute
- Printer Friendly Page
- Mark as New
- Bookmark
- Subscribe
- Mute
- Subscribe to RSS Feed
- Permalink
- Report Inappropriate Content
Restricting to first visit
I have a requirement where I need to show a graph of the number of new visits per month for a study
So for a Study A, for visits we have to use the visit types which are shown as:
V0
V1
V2
V3
V4
V0 for example would be the new visits that I am needing to use for my chart. Other studies have different visit types for new visits like T0, or V1. What expression can I use to show the count of the first visit type?
For example, for study A if I take count of v0 for Jan I should get 24, but with the expression that I am using:
=Count({$<visittype={$(=min(visittype))}>}visittype)
I am getting 0, not 24. Is there something wrong with the expression that I am using?
- « Previous Replies
-
- 1
- 2
- Next Replies »
- Mark as New
- Bookmark
- Subscribe
- Mute
- Subscribe to RSS Feed
- Permalink
- Report Inappropriate Content
HI @aswinnar
V0, V1 is the string. so you can try with Minstring() function
=Count({$<visittype={'$(=Minstring(visittype))'}>}visittype)
or
Create a flag or dual function to calculate it.
Please close the thread by marking correct answer & give likes if you like the post.
- Mark as New
- Bookmark
- Subscribe
- Mute
- Subscribe to RSS Feed
- Permalink
- Report Inappropriate Content
Hi @MayilVahanan ,
That seems to be working, however when applying to my line chart instead of showing multiple lines for each study I am only getting one line now. Is there a reason for this? If I filter for each one they show, and if I use an expression such as
=Count({$<visittype+={'$(=Minstring(visittype))'}>}visittype)
All the lines for the studies show, but not the case for the expression you gave. Any reason why?
- Mark as New
- Bookmark
- Subscribe
- Mute
- Subscribe to RSS Feed
- Permalink
- Report Inappropriate Content
Hi @aswinnar
Can you provide the sample data and expected output. so that, its help to understand better.
Please close the thread by marking correct answer & give likes if you like the post.
- Mark as New
- Bookmark
- Subscribe
- Mute
- Subscribe to RSS Feed
- Permalink
- Report Inappropriate Content
Thanks for the information keep sharing MyGiftCardSite
- Mark as New
- Bookmark
- Subscribe
- Mute
- Subscribe to RSS Feed
- Permalink
- Report Inappropriate Content
PFA excel file containing sample data that I am using for the graph
I am trying to create a multi line chart based on new visits per month for a study. The line graph should show multiple lines, for each study. The issue I had come across was implementing the logic to get the min visits (new visits), using the expression Count({$<visittype+={'$(=Minstring(visittype))'}>}visittype)
Using that expression, I am only getting a single line, the other lines for the other studies are not showing up.
In the line chart I am also using an aggregated dimension for visit date, as we are showing new visits over 2020 for different studies
The calculated dimension is: =aggr(only({<Visit_Date ={"*2020"}>} Visit_Date),Visit_Date)
Let me know if you are needing any more details
- Mark as New
- Bookmark
- Subscribe
- Mute
- Subscribe to RSS Feed
- Permalink
- Report Inappropriate Content
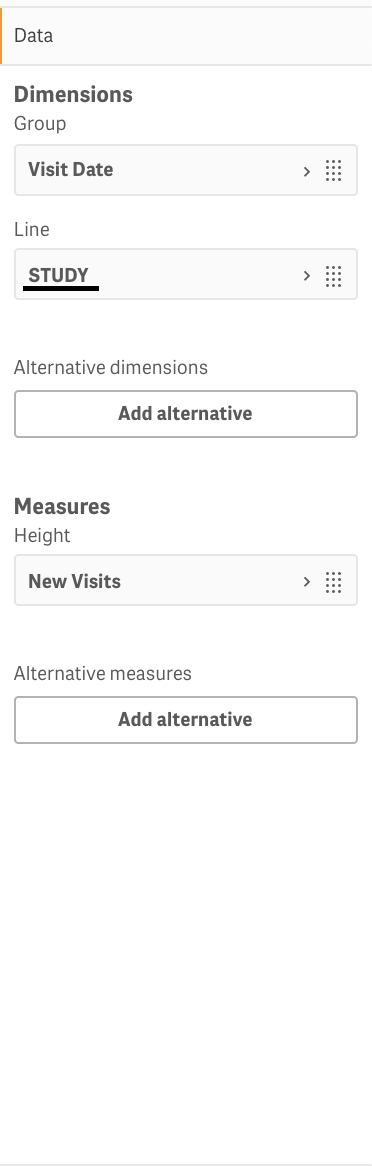
Hi @aswinnar
You need to add study as Dimension to display multiple lines for study in line chart
like below

Please close the thread by marking correct answer & give likes if you like the post.
- Mark as New
- Bookmark
- Subscribe
- Mute
- Subscribe to RSS Feed
- Permalink
- Report Inappropriate Content
As shown in the screenshots I have added Study as a dimension in the qlik linechart, but I am still only getting the one line
Is there something else that I am doing wrong? Or is it a Qlik Sense bug? I have also tried with the vizlib linechart extension and am encountering the same issue
- Mark as New
- Bookmark
- Subscribe
- Mute
- Subscribe to RSS Feed
- Permalink
- Report Inappropriate Content
Hi @MayilVahanan ,
I had told you the wrong expression,
I am using
Count({$<visittype={'$(=Minstring(visittype))'}>}visittype) as the measure, which is causing me problems.
Whenever I use Count({$<visittype+={'$(=Minstring(visittype))'}>}visittype) it is working but I am needing to create chart for Count({$<visittype={'$(=Minstring(visittype))'}>}visittype), so that is should show for only the new visits, not for all the visits.
- Mark as New
- Bookmark
- Subscribe
- Mute
- Subscribe to RSS Feed
- Permalink
- Report Inappropriate Content
Hi @aswinnar
For sample data, can you say the expected output?
meanwhile, you can try like below also
Sum(Aggr(if(visittype = MinString(Total<STUDY> visittype), 1), STUDY, Visit_Date, visittype))
Please close the thread by marking correct answer & give likes if you like the post.
- « Previous Replies
-
- 1
- 2
- Next Replies »