Unlock a world of possibilities! Login now and discover the exclusive benefits awaiting you.

- Qlik Community
- :
- Forums
- :
- Analytics & AI
- :
- Products & Topics
- :
- App Development
- :
- Row by Row Calculation in Bar Chart
Options
- Subscribe to RSS Feed
- Mark Topic as New
- Mark Topic as Read
- Float this Topic for Current User
- Bookmark
- Subscribe
- Mute
- Printer Friendly Page
Turn on suggestions
Auto-suggest helps you quickly narrow down your search results by suggesting possible matches as you type.
Showing results for

 Sazabi
Creator
2020-12-11
02:20 PM
- Mark as New
- Bookmark
- Subscribe
- Mute
- Subscribe to RSS Feed
- Permalink
- Report Inappropriate Content
Row by Row Calculation in Bar Chart
Salutations Qliksters!
What would be the best way to calculate "row-by-row" in a bar chart with an expression that uses set analysis?
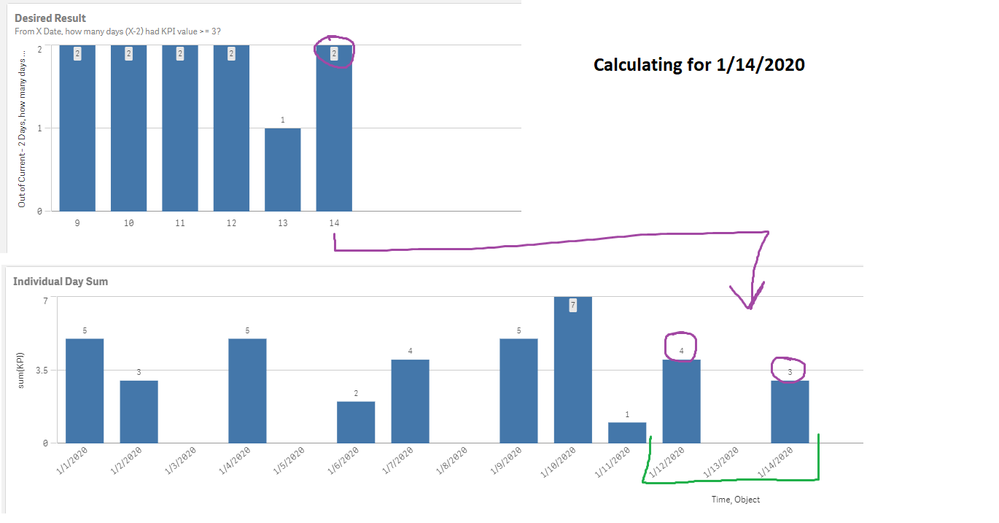
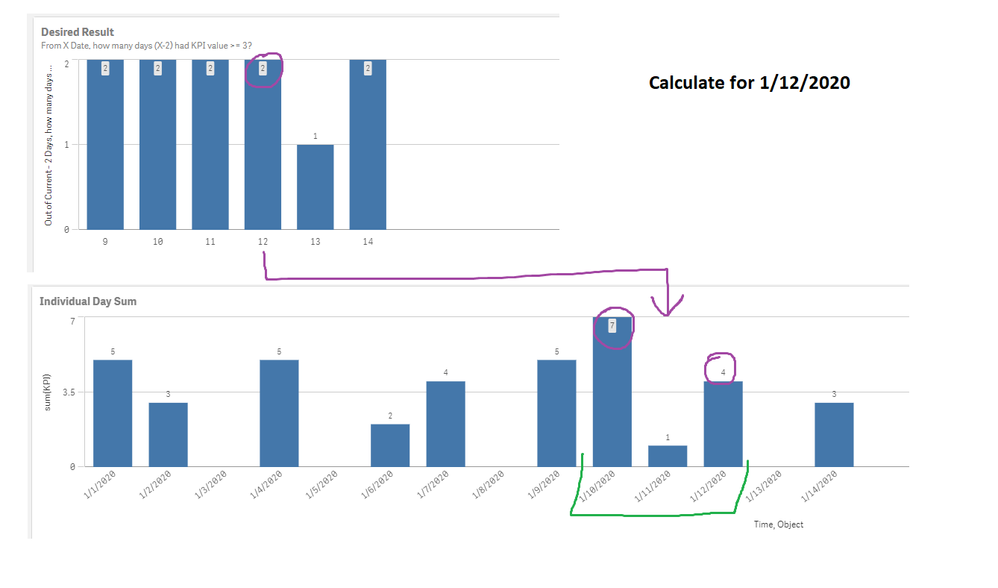
For each day, I want to find, within a defined date range, how many days a KPI value was exceeded per day.
Here is the desired output:
Within 1/12/2020 thru 1/14/2020, there were 2 days that had KPI value >=3
-------------
Within 1/11/2020 thru 1/13/2020, there was 1 day that had KPI value >=3

------------------
Within 1/10/2020 thru 1/12/2020, there were 2 days that had KPI value >=3
etc, etc....
Any ideas?
Thanks!!!
S
568 Views
0 Replies
