Unlock a world of possibilities! Login now and discover the exclusive benefits awaiting you.
Announcements
Now accepting applications for the Qlik Luminary and Partner Ambassador Programs: Apply by July 6!
- Qlik Community
- :
- Forums
- :
- Analytics & AI
- :
- Products & Topics
- :
- App Development
- :
- SVG Reader Map - Qlik Sense - Issue black map disp...
Options
- Subscribe to RSS Feed
- Mark Topic as New
- Mark Topic as Read
- Float this Topic for Current User
- Bookmark
- Subscribe
- Mute
- Printer Friendly Page
Turn on suggestions
Auto-suggest helps you quickly narrow down your search results by suggesting possible matches as you type.
Showing results for
Not applicable
2017-05-10
10:48 AM
- Mark as New
- Bookmark
- Subscribe
- Mute
- Subscribe to RSS Feed
- Permalink
- Report Inappropriate Content
SVG Reader Map - Qlik Sense - Issue black map displayed over the original
Hello Experts!
I am using in a Qlik Sense app the extension SVG reader.
The extension is incredible, but for one issue I have: once the sheet is opened, the map is showed like this (with the black map on it):
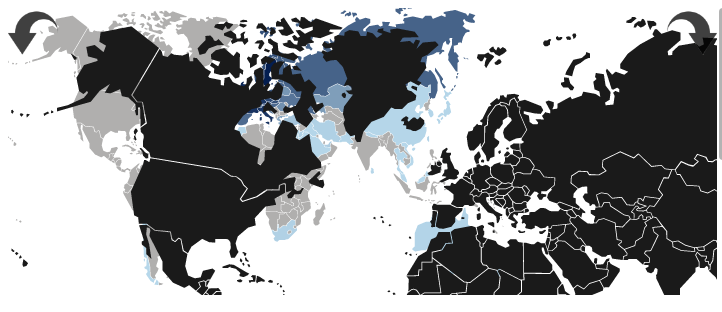
only when something is selected (e.g. filters, bars in barchart...) the map return normal, like this:
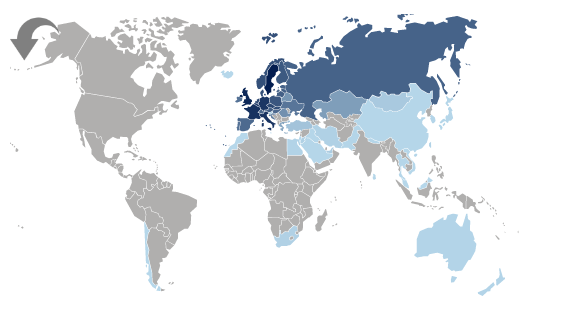
Any help? I am connecting to each country the 2-letters code (and it worked perfectly besides this issue).
640 Views
0 Replies