Unlock a world of possibilities! Login now and discover the exclusive benefits awaiting you.
- Qlik Community
- :
- Forums
- :
- Analytics & AI
- :
- Products & Topics
- :
- App Development
- :
- Scatter Plot - How To Show Basic Rows
Options
- Subscribe to RSS Feed
- Mark Topic as New
- Mark Topic as Read
- Float this Topic for Current User
- Bookmark
- Subscribe
- Mute
- Printer Friendly Page
Turn on suggestions
Auto-suggest helps you quickly narrow down your search results by suggesting possible matches as you type.
Showing results for
Contributor
2021-03-19
05:02 AM
- Mark as New
- Bookmark
- Subscribe
- Mute
- Subscribe to RSS Feed
- Permalink
- Report Inappropriate Content
Scatter Plot - How To Show Basic Rows
Hello folks,
I'm using Qlik Sense June 2019 Patch 3 version.
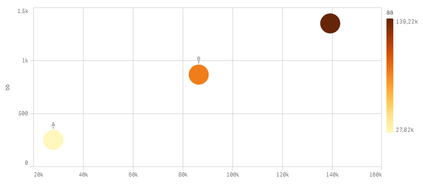
When I hover on a bubble in the Scatter Plot ,
it doesn't show basic rows which are measure and dimension details. But it does in different versions that have tooltip feature. I would like to see the details pane showing up like in the below image.
Thanks for advance.
- Tags:
- qlik sense
0 Replies

