Unlock a world of possibilities! Login now and discover the exclusive benefits awaiting you.
- Qlik Community
- :
- Forums
- :
- Analytics
- :
- App Development
- :
- Scatter plot : categorizing products into their pr...
Options
- Subscribe to RSS Feed
- Mark Topic as New
- Mark Topic as Read
- Float this Topic for Current User
- Bookmark
- Subscribe
- Mute
- Printer Friendly Page
Turn on suggestions
Auto-suggest helps you quickly narrow down your search results by suggesting possible matches as you type.
Showing results for
Anonymous
Not applicable
2017-09-08
07:07 AM
- Mark as New
- Bookmark
- Subscribe
- Mute
- Subscribe to RSS Feed
- Permalink
- Report Inappropriate Content
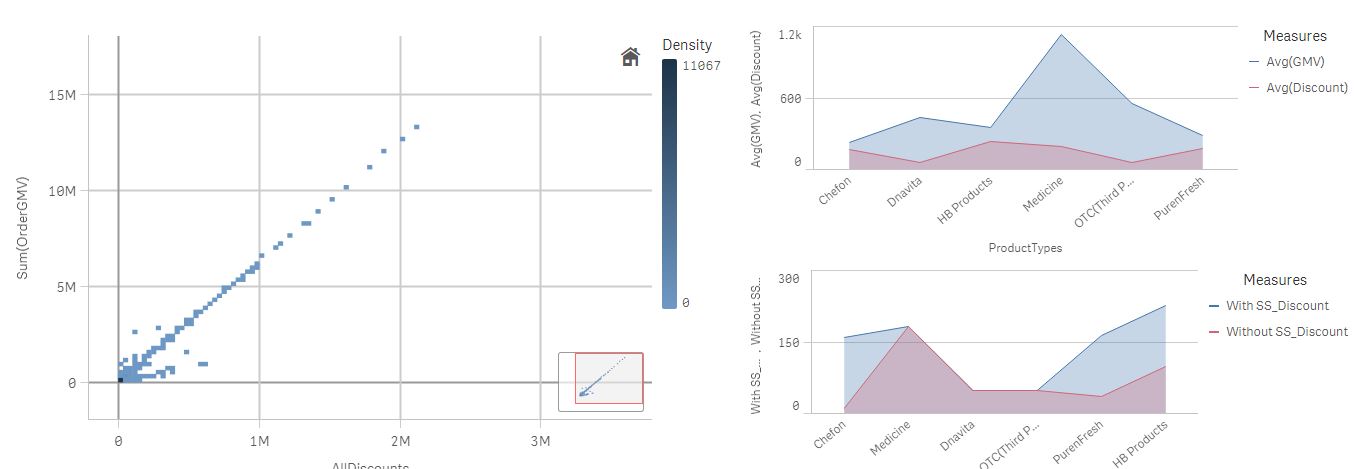
Scatter plot : categorizing products into their product types
I have data of products which can be categorized as medicine, beauty products, food products, etc. I want a scatter plot of these products but I also want to see a clear categorization of all products. What i mean is, All medicine in scatter plot must look green bubbles, food products to look blue bubbles, beauty products to look red bubbles. How can i achieve this ?
Please Help
- Tags:
- scatter plot diagram
381 Views
1 Solution
Accepted Solutions
Partner - Master III
2017-09-08
07:13 AM
- Mark as New
- Bookmark
- Subscribe
- Mute
- Subscribe to RSS Feed
- Permalink
- Report Inappropriate Content
in Color by Expression,
Use,
Pick(Wildmatch(Category,'Food','Beauty','Medicine'),
Red(),blue(),green())
315 Views
2 Replies
Partner - Master III
2017-09-08
07:13 AM
- Mark as New
- Bookmark
- Subscribe
- Mute
- Subscribe to RSS Feed
- Permalink
- Report Inappropriate Content
in Color by Expression,
Use,
Pick(Wildmatch(Category,'Food','Beauty','Medicine'),
Red(),blue(),green())
316 Views
Anonymous
Not applicable
2017-09-11
03:00 AM
Author
- Mark as New
- Bookmark
- Subscribe
- Mute
- Subscribe to RSS Feed
- Permalink
- Report Inappropriate Content
It worked perfectly. Thank you so much for your help 
315 Views
Community Browser