Unlock a world of possibilities! Login now and discover the exclusive benefits awaiting you.
- Qlik Community
- :
- Forums
- :
- Analytics & AI
- :
- Products & Topics
- :
- App Development
- :
- Re: Simple KPI not working in Mashup
- Subscribe to RSS Feed
- Mark Topic as New
- Mark Topic as Read
- Float this Topic for Current User
- Bookmark
- Subscribe
- Mute
- Printer Friendly Page
- Mark as New
- Bookmark
- Subscribe
- Mute
- Subscribe to RSS Feed
- Permalink
- Report Inappropriate Content
Simple KPI not working in Mashup
Hi,
I am trying to use the Simple KPI extension where I am combining a KPI and a line chart into a card like layout. I am doing this in 4 QS apps that I have built. Now I want to show all these 4 cards with KPI and line charts in a mashup page. The first card works fine when I drag that onto the mashup, it's only when I import another one of these cards from a different app, I get an error which says, No Object with ID ‘objectID’ found.
The object ID here is the same as the ID that is found in the Line chart that I am embedding in the simple KPI extension. SO my questions here are:
1. Is there a compatibility issue between Simple KPI extension and Mashup in Qlik Sense?
2. Is there any other way for me to combine a KPI and a line chart and show it as a card? Or in a broader sense, can I combine 2 or more graphs/charts and make it look like 1 in Sense?
P.S. - I am using Sense Server 3.1 (so that's the latest as far as I know).
Any help would be appreciated.
Thank you,
Akshay
- « Previous Replies
-
- 1
- 2
- Next Replies »
- Mark as New
- Bookmark
- Subscribe
- Mute
- Subscribe to RSS Feed
- Permalink
- Report Inappropriate Content
Hi,
I have exactly the same problem, did you find a solution meanwhile ?
Thanks,
Xavier
- Mark as New
- Bookmark
- Subscribe
- Mute
- Subscribe to RSS Feed
- Permalink
- Report Inappropriate Content
Hello Community,
I still face the problem, does someone have an idea to solve the problem ?
Thank you,
Xavier
- Mark as New
- Bookmark
- Subscribe
- Mute
- Subscribe to RSS Feed
- Permalink
- Report Inappropriate Content
Dear Community,
I hope this message finds you well.
We have the same issue.
Is there a known issue between Simple KPI and Mashup in Qlik Sense?
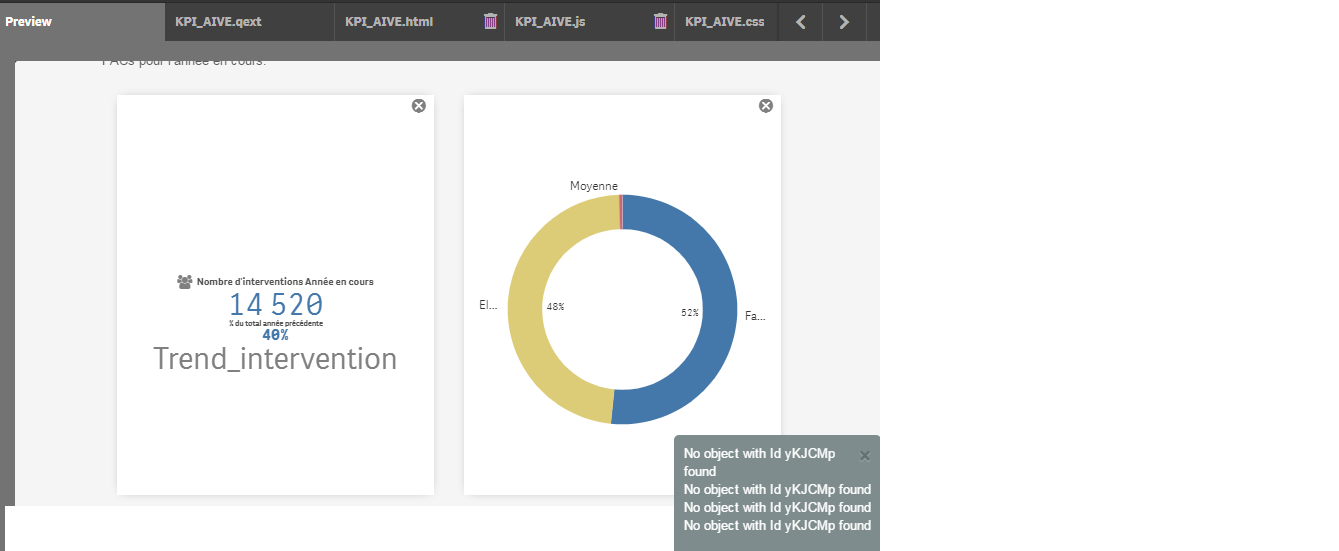
Please find attached a screenshot of the error.
Thank you in advance for your time.
Kindest regards,
Nicolas.
- Mark as New
- Bookmark
- Subscribe
- Mute
- Subscribe to RSS Feed
- Permalink
- Report Inappropriate Content
Hello Community,
We finally find a simple workaround for this issue :
don't use the drag and drop functionnality in mashup template (that generate automatically getObject request in Javascript file) instead just use the iframe of the simple KPI object from the single generator in the html file.
Kind Regards,
Xavier
- Mark as New
- Bookmark
- Subscribe
- Mute
- Subscribe to RSS Feed
- Permalink
- Report Inappropriate Content
Hello Xavier, we have the same issue, can you explain a little bit the workaround that you found?
Kind regards,
Franco
- Mark as New
- Bookmark
- Subscribe
- Mute
- Subscribe to RSS Feed
- Permalink
- Report Inappropriate Content
Hello Franco,
Use the iframe code of the simpleKPI object instead of the ObjectID (this one is automatically generated when you drag and drop an object in mashup) :
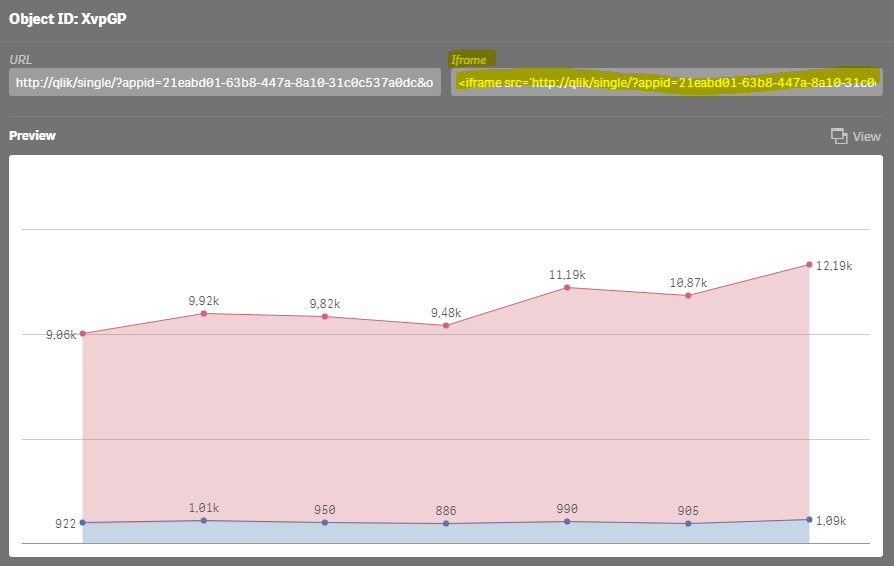
then put the iframe in the html in the folowing way for example :
<div class="row">
<div class="col-sm-6 col-md-4 col-lg-4 ">
<div class="borderShadow qvobject">
<iframe src='http://qlik/single/?appid=0841095f-25b9-4cae-acf7-1d3159566263&obj=YNmHQ&opt=nointeraction&select=cl...' style='border:none;width: 100%;height: 100%;'></iframe>
</div>
<p>xxxxxxxxxxxxxxxxxxxxxxxxxxxx.</p>
</div>
INSTEAD of
<div class="borderShadow qvobject" id="QV11"> </div>
in the javascript file take care of cleaning the app.getObject related to a previous drag and drop otherwise an error message will popup
Kind Regards,
- Mark as New
- Bookmark
- Subscribe
- Mute
- Subscribe to RSS Feed
- Permalink
- Report Inappropriate Content
Xavier, its very clear now. Thanks for the response!
Best Regards
- Mark as New
- Bookmark
- Subscribe
- Mute
- Subscribe to RSS Feed
- Permalink
- Report Inappropriate Content
Hey!
While you're at it, have a look at Vizlib's new supported KPI designer:
Keen to hear your thoughts!
Best,
Martin
- Mark as New
- Bookmark
- Subscribe
- Mute
- Subscribe to RSS Feed
- Permalink
- Report Inappropriate Content
Hi,
Can we customize CSS in Iframe mashup.I want to add a background color and some margin-topping.?
I tried using the developer tools where i can change the color and able to add some topping, but i could not able to use the customized CSS obtained from developer tool in the mashup code. Is that because of the auto-generated code? .
Please,let me know if there is a way to use customize the object.
Regards
- « Previous Replies
-
- 1
- 2
- Next Replies »