Unlock a world of possibilities! Login now and discover the exclusive benefits awaiting you.
- Qlik Community
- :
- Forums
- :
- Analytics & AI
- :
- Products & Topics
- :
- App Development
- :
- Sort Sales Line Chart by Day/Month Dimension
- Subscribe to RSS Feed
- Mark Topic as New
- Mark Topic as Read
- Float this Topic for Current User
- Bookmark
- Subscribe
- Mute
- Printer Friendly Page
- Mark as New
- Bookmark
- Subscribe
- Mute
- Subscribe to RSS Feed
- Permalink
- Report Inappropriate Content
Sort Sales Line Chart by Day/Month Dimension
Any insight on how to fix the following sorting issue?
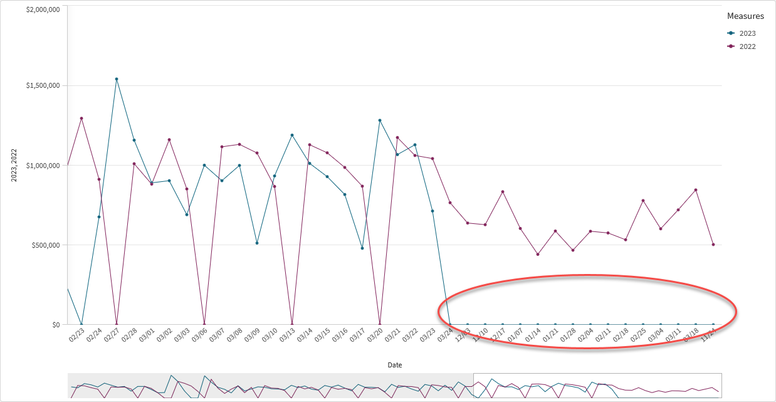
I have a line chart of "Daily Sales" which compared the sum of sales for a Month/Day range (we'll call this Measure1) against the same period the previous year (we'll call this Measure2). I cannot get it to sort by Month/Day to save my life. the chart will sort by Month/Day for any date that has a value for Measure1 regardless if there is a value for the same Month/Day in Measure2 but if there is no value in Measure1, the Month/Day is placed at the end of the chart.
Making the Month/Day value into a number instead of a date will allow to sort correctly until your date range overlaps years. So in the screen shot below we are comparing '2022-24-11 thru 2023-24-03' against' 2021-24-11 thru 2022-24-03' sorted by date shows:
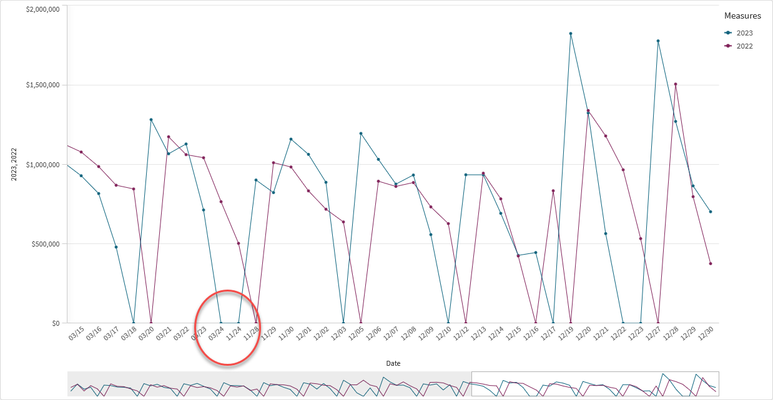
Whereas, if i convert the Month/Day value to a number all the November and December dates get thrown to the end of chart:
- Mark as New
- Bookmark
- Subscribe
- Mute
- Subscribe to RSS Feed
- Permalink
- Report Inappropriate Content
It should be just about logic. Is it a date or is it a string showing Month/Day ?
If it is a string , then try this for sorting:
Sort by expression, Numerically ascending
= (Num(Subfield([Month/Day], '/', 1)) * 12) + Num(Subfield([Month/Day], '/', 2))

