Unlock a world of possibilities! Login now and discover the exclusive benefits awaiting you.
- Qlik Community
- :
- Forums
- :
- Analytics & AI
- :
- Products & Topics
- :
- App Development
- :
- Stop gray colour when making selection (QlikSense)
- Subscribe to RSS Feed
- Mark Topic as New
- Mark Topic as Read
- Float this Topic for Current User
- Bookmark
- Subscribe
- Mute
- Printer Friendly Page
- Mark as New
- Bookmark
- Subscribe
- Mute
- Subscribe to RSS Feed
- Permalink
- Report Inappropriate Content
Stop gray colour when making selection (QlikSense)
Hi Qlik Community
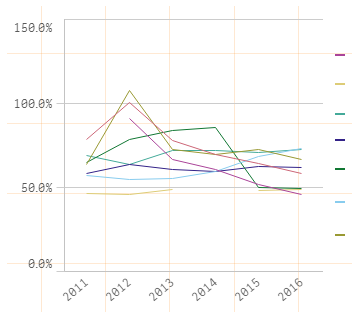
I need a graph not to change when a selection/filter is made, but I am having trouble keeping colours on the graph. Let's take a simple case of a visualisation with 2 Dimensions (Year and Name) and 1 Measure (Ratio):
Graphs with no selection (i.e. wanted outcome in all cases):
Graph when one of its dimensions -[Name]- is filtered (current case to fix):
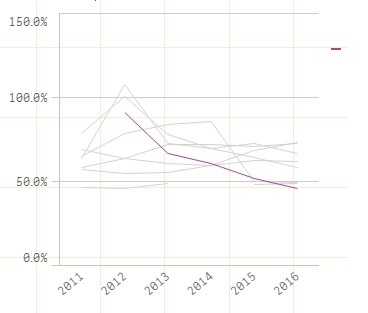
My current formula is with a simple set analysis: Avg({1} [Measure1]).
I have tried different variations, but I cannot seem to get the colours to stay "colourful" and not go gray.
Any ideas?
Thanks!
M
- Mark as New
- Bookmark
- Subscribe
- Mute
- Subscribe to RSS Feed
- Permalink
- Report Inappropriate Content
How you have set colors?
- Mark as New
- Bookmark
- Subscribe
- Mute
- Subscribe to RSS Feed
- Permalink
- Report Inappropriate Content
Hey, both AUTO or By Dimension -> [Name] give the same result in this case.