Unlock a world of possibilities! Login now and discover the exclusive benefits awaiting you.
Announcements
Qlik and ServiceNow Partner to Bring Trusted Enterprise Context into AI-Powered Workflows. Learn More!
- Qlik Community
- :
- Forums
- :
- Analytics & AI
- :
- Products & Topics
- :
- App Development
- :
- The data set contains Negative or Zero values that...
Options
- Subscribe to RSS Feed
- Mark Topic as New
- Mark Topic as Read
- Float this Topic for Current User
- Bookmark
- Subscribe
- Mute
- Printer Friendly Page
Turn on suggestions
Auto-suggest helps you quickly narrow down your search results by suggesting possible matches as you type.
Showing results for
Anonymous
Not applicable
2016-02-12
06:18 AM
- Mark as New
- Bookmark
- Subscribe
- Mute
- Subscribe to RSS Feed
- Permalink
- Report Inappropriate Content
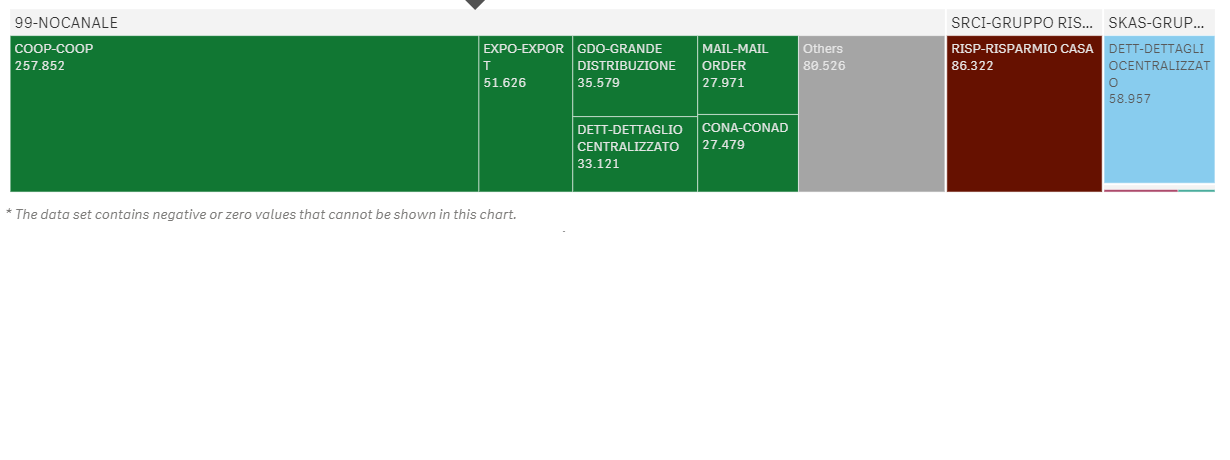
The data set contains Negative or Zero values that can not be shown in this chart
Hi Folks,
I am working on QlikeSense on the object Treemap, I have two dimenstions and one measure. When the chart is displayed I get the following error "The data set contains Negative or Zero values that can not be shown in this chart" on the bottom of the chart. As follows:
And I want to remove this message from the chart. Could you please help me 
Thanks in advance.
3,971 Views
1 Reply
Partner - Champion III
2016-02-12
12:44 PM
- Mark as New
- Bookmark
- Subscribe
- Mute
- Subscribe to RSS Feed
- Permalink
- Report Inappropriate Content
Then remove the data that causes negative or zero values from the data set. Perhaps you can use a bit of set analysis to do this.
talk is cheap, supply exceeds demand