Unlock a world of possibilities! Login now and discover the exclusive benefits awaiting you.
- Qlik Community
- :
- Forums
- :
- Analytics & AI
- :
- Products & Topics
- :
- App Development
- :
- Re: Total of rows in sum instead of avg
- Subscribe to RSS Feed
- Mark Topic as New
- Mark Topic as Read
- Float this Topic for Current User
- Bookmark
- Subscribe
- Mute
- Printer Friendly Page
- Mark as New
- Bookmark
- Subscribe
- Mute
- Subscribe to RSS Feed
- Permalink
- Report Inappropriate Content
Total of rows in sum instead of avg
Hi all,
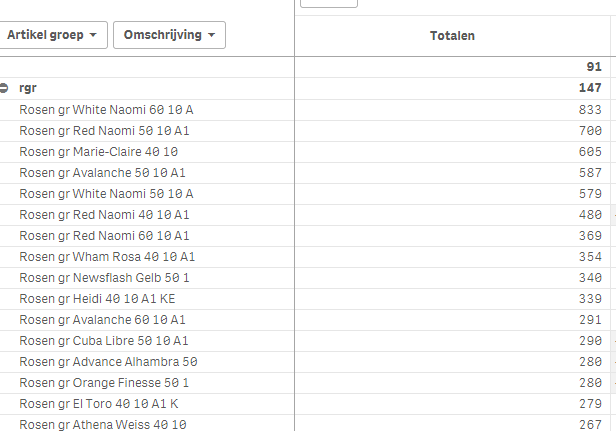
I created a pivot chart using avg sales per product.
Our products are summarized in categories.
Now I need to have a sum of the total avg per category instead of the avg per category.
is this posible?
Thanks in advance
Accepted Solutions
- Mark as New
- Bookmark
- Subscribe
- Mute
- Subscribe to RSS Feed
- Permalink
- Report Inappropriate Content
- Mark as New
- Bookmark
- Subscribe
- Mute
- Subscribe to RSS Feed
- Permalink
- Report Inappropriate Content
Try this:
Sum(Aggr(YourExpression, YourDimensionsFromThePivotTable))
- Mark as New
- Bookmark
- Subscribe
- Mute
- Subscribe to RSS Feed
- Permalink
- Report Inappropriate Content
can you post sample app?
- Mark as New
- Bookmark
- Subscribe
- Mute
- Subscribe to RSS Feed
- Permalink
- Report Inappropriate Content
- Mark as New
- Bookmark
- Subscribe
- Mute
- Subscribe to RSS Feed
- Permalink
- Report Inappropriate Content
Not sure if I fully understand.
It would be helpful if you could explain your setting with some sample lines of data and expected result.
You may also need to check for expression evaluation per Dimensionality() or SecondaryDimensionality() (for horizontal dimensions) depending on your need to use different aggregations on different aggregation levels, like
=If(Dimensionality() = 0,
Sum( Aggr( Avg(Sales), Category, Product)), // or maybe Sum( Aggr( Avg(Sales), Category)) ?
Avg(Sales)
)
- Mark as New
- Bookmark
- Subscribe
- Mute
- Subscribe to RSS Feed
- Permalink
- Report Inappropriate Content
Hi Sunny,
The formula worked for the totals
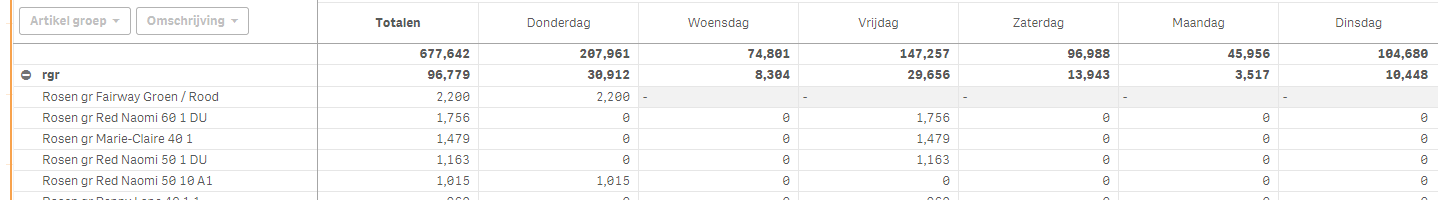
But now the data of my columns doesn’t are changed.
Can you help me with that?
Before
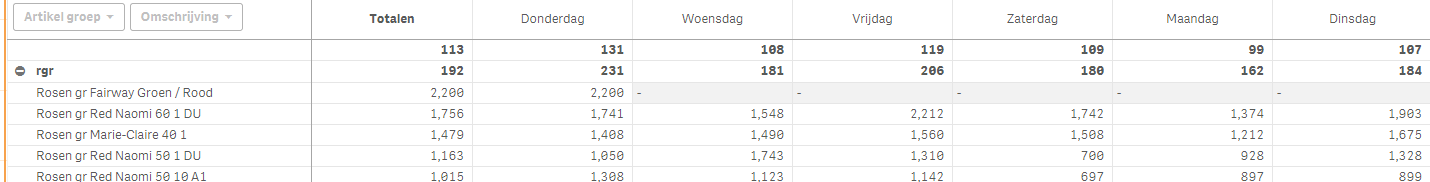
After
- Mark as New
- Bookmark
- Subscribe
- Mute
- Subscribe to RSS Feed
- Permalink
- Report Inappropriate Content
What all dimensions do you have? and what expression did you use?
- Mark as New
- Bookmark
- Subscribe
- Mute
- Subscribe to RSS Feed
- Permalink
- Report Inappropriate Content
Maybe you forgot to add the Weekday dimension (omschriving?) to the aggr() dimension list?
- Mark as New
- Bookmark
- Subscribe
- Mute
- Subscribe to RSS Feed
- Permalink
- Report Inappropriate Content
Sum(Aggr(Avg(Aantal),Omschrijving))
Expression:
- Avg(aantal)
Dimensions:
- Artikel groep
- Omschrijving
Collumns
- Dag
- Mark as New
- Bookmark
- Subscribe
- Mute
- Subscribe to RSS Feed
- Permalink
- Report Inappropriate Content
Try this:
Sum(Aggr(Avg(Aantal),Omschrijving, [Artikel groep]))