Unlock a world of possibilities! Login now and discover the exclusive benefits awaiting you.
- Qlik Community
- :
- Forums
- :
- Analytics & AI
- :
- Products & Topics
- :
- App Development
- :
- Totals In Pivot Table with Measures as Rows
- Subscribe to RSS Feed
- Mark Topic as New
- Mark Topic as Read
- Float this Topic for Current User
- Bookmark
- Subscribe
- Mute
- Printer Friendly Page
- Mark as New
- Bookmark
- Subscribe
- Mute
- Subscribe to RSS Feed
- Permalink
- Report Inappropriate Content
Totals In Pivot Table with Measures as Rows
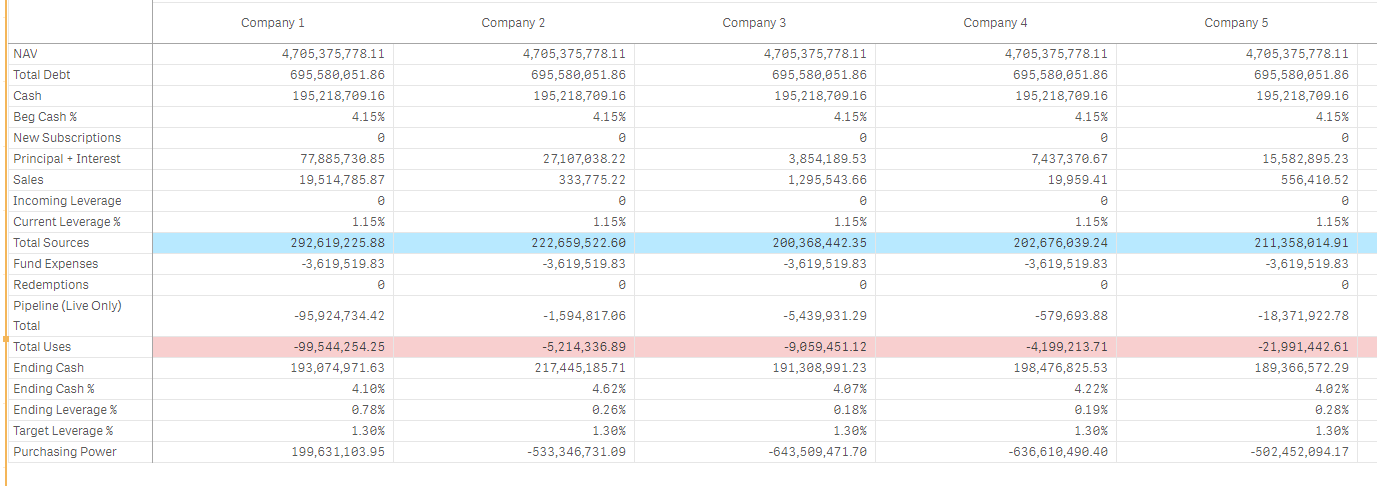
Hi All I have the below Pivot Table which has measures as the rows. Is it possible to get totals for each measure?

Accepted Solutions
- Mark as New
- Bookmark
- Subscribe
- Mute
- Subscribe to RSS Feed
- Permalink
- Report Inappropriate Content
Oh got it... may be add a island table in the script like this
Dim:
LOAD * INLINE [
Dim
1
2
];
and then change your Company dimension to this
Pick(Dim, Company, 'Total')
- Mark as New
- Bookmark
- Subscribe
- Mute
- Subscribe to RSS Feed
- Permalink
- Report Inappropriate Content
So, NAV, Total Debt, Cash.... etc are values within a field? and you would like to add Total Sources and Total Uses as extra values?
- Mark as New
- Bookmark
- Subscribe
- Mute
- Subscribe to RSS Feed
- Permalink
- Report Inappropriate Content
Ah sorry ignore the coloring. Each row is a different measure/expression and I would like to show totals for each measure across all companies. So ideally there would be a totals column which shows the totals for each measure. i.e total nav = Company 1 NAV + Company 2 NAV + Company 3 NAV Etc
- Mark as New
- Bookmark
- Subscribe
- Mute
- Subscribe to RSS Feed
- Permalink
- Report Inappropriate Content
Oh got it... may be add a island table in the script like this
Dim:
LOAD * INLINE [
Dim
1
2
];
and then change your Company dimension to this
Pick(Dim, Company, 'Total')
- Mark as New
- Bookmark
- Subscribe
- Mute
- Subscribe to RSS Feed
- Permalink
- Report Inappropriate Content
Awesome thanks!
- Mark as New
- Bookmark
- Subscribe
- Mute
- Subscribe to RSS Feed
- Permalink
- Report Inappropriate Content
One more question. My total responds to selections made, ie if I select company 1 the total column will show the same values as just company one. Do you have an idea on how to have the total column show values for the whole data set.
- Mark as New
- Bookmark
- Subscribe
- Mute
- Subscribe to RSS Feed
- Permalink
- Report Inappropriate Content
May be try this expression
Pick(Dim,
Sum(Measure),
Sum({1} Measure))
- Mark as New
- Bookmark
- Subscribe
- Mute
- Subscribe to RSS Feed
- Permalink
- Report Inappropriate Content
Will it be possible to make the same, but for columns?