Unlock a world of possibilities! Login now and discover the exclusive benefits awaiting you.
- Qlik Community
- :
- Forums
- :
- Analytics & AI
- :
- Products & Topics
- :
- App Development
- :
- Totals function (sum) for bar chart?
- Subscribe to RSS Feed
- Mark Topic as New
- Mark Topic as Read
- Float this Topic for Current User
- Bookmark
- Subscribe
- Mute
- Printer Friendly Page
- Mark as New
- Bookmark
- Subscribe
- Mute
- Subscribe to RSS Feed
- Permalink
- Report Inappropriate Content
Totals function (sum) for bar chart?
Hi Qlik's communites,
I'm trying to get bar chart to show Total Sum like on the right value 143,382.54 (yellow highlighted). Of course this is on a table which can be change with the totals functions so it will not reflect sum of GRA 195,374.61 (yellow highlighted).
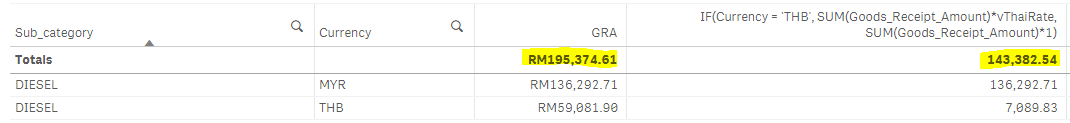
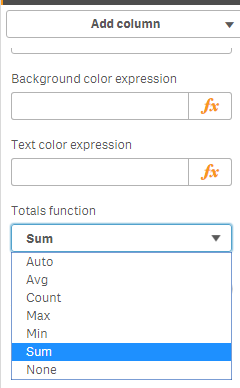
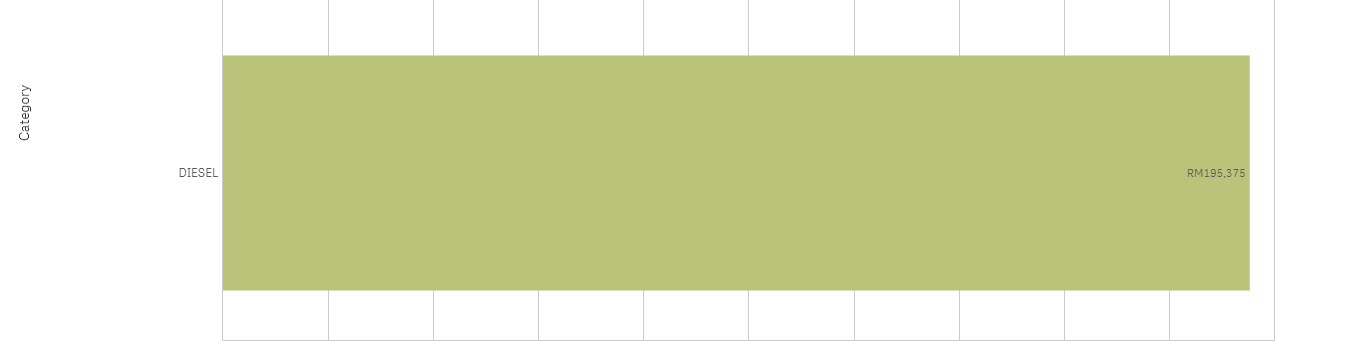
But in bar chart we're not given Totals function and the sum is 195,374.61. So how can I done this in bar chart or modification to my expression?
Accepted Solutions
- Mark as New
- Bookmark
- Subscribe
- Mute
- Subscribe to RSS Feed
- Permalink
- Report Inappropriate Content
Try this
Sum(Aggr(
If(Currency = 'THB', Sum(Goods_Receipt_Amount)*vThaiRate, Sum(Goods_Receipt_Amount))
, Sub_Category, Currency))
Also, look here
This link is for pivot table, but is applicable for other charts also
- Mark as New
- Bookmark
- Subscribe
- Mute
- Subscribe to RSS Feed
- Permalink
- Report Inappropriate Content
Yeap, like the other question, same formula
- Mark as New
- Bookmark
- Subscribe
- Mute
- Subscribe to RSS Feed
- Permalink
- Report Inappropriate Content
Hi Sunny
I am facing the same issue, somehow it is not working despite using Sum(Aggr), can you please advise?
When I change to Sum in Total Function in the table is correct number but in the chart it is not excluding as it should.
Many thanks
IF(SUM(AGGR($(vPrice),[pn])) > SUM(AGGR($(vContrPrice),[pn]))
or SUM(AGGR($(vPrice),[pn])) = SUM(AGGR($(vContrPrice),[pn])),
FABS(SUM(AGGR($(vP_Lost_Test),[pn]))))