Unlock a world of possibilities! Login now and discover the exclusive benefits awaiting you.

- Qlik Community
- :
- Forums
- :
- Analytics & AI
- :
- Products & Topics
- :
- App Development
- :
- Re: Totals in bar Chart
- Subscribe to RSS Feed
- Mark Topic as New
- Mark Topic as Read
- Float this Topic for Current User
- Bookmark
- Subscribe
- Mute
- Printer Friendly Page

 dnagarajan
- Mark as New
- Bookmark
- Subscribe
- Mute
- Subscribe to RSS Feed
- Permalink
- Report Inappropriate Content
Totals in bar Chart
Hey..
How to attain the average in totals in bar Chart instead of sum .
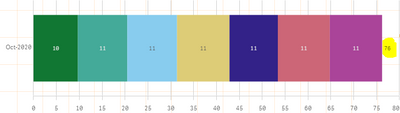
Appreciate any quick help. Thanks
- Tags:
- qliksense app

 Kushal_Chawda
- Mark as New
- Bookmark
- Subscribe
- Mute
- Subscribe to RSS Feed
- Permalink
- Report Inappropriate Content
@dnagarajan not clear what you are looking at. Can you please elaborate
dnagarajan
- Mark as New
- Bookmark
- Subscribe
- Mute
- Subscribe to RSS Feed
- Permalink
- Report Inappropriate Content
Hi @Kushal_Chawda..
this is qlik native bar chart.
Dimension is stacked category & month, Measure is just sum(field1)/sum(field2).
Totals is displayed as Sum of all values (76). instead i want to display Average in totals(~10.8)
 forte
forte
- Mark as New
- Bookmark
- Subscribe
- Mute
- Subscribe to RSS Feed
- Permalink
- Report Inappropriate Content
Hi @dnagarajan
I'm affraid you can't change that issue. Bar chart is always totalizing as a adding values of all segments (try with an avg, it does just de same addition).
You should use two different charts, or may be a combo chart with average as a line (or symbol) on secondary axis.
Hope it helps
Regards
dnagarajan
- Mark as New
- Bookmark
- Subscribe
- Mute
- Subscribe to RSS Feed
- Permalink
- Report Inappropriate Content
Thanks @forte i also thought of the same combo chart idea. 🤗
Trying to grasp folk's workaround solution for the same.
Kushal_Chawda
- Mark as New
- Bookmark
- Subscribe
- Mute
- Subscribe to RSS Feed
- Permalink
- Report Inappropriate Content
@dnagarajan as others mentioned, you can't directly do it , as a work around you can use custom tool tips where in you can represent the avg values.
