Unlock a world of possibilities! Login now and discover the exclusive benefits awaiting you.
- Qlik Community
- :
- Forums
- :
- Analytics
- :
- App Development
- :
- Treemap - coloring by measure, display percentage
- Subscribe to RSS Feed
- Mark Topic as New
- Mark Topic as Read
- Float this Topic for Current User
- Bookmark
- Subscribe
- Mute
- Printer Friendly Page
- Mark as New
- Bookmark
- Subscribe
- Mute
- Subscribe to RSS Feed
- Permalink
- Report Inappropriate Content
Treemap - coloring by measure, display percentage
Hi,
I have a problem regarding Treemap and proper display percentage value in tooltip.
Treemap is configured as follows:
Dimension is Brand
Measure is Margin (value)
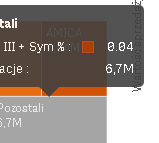
And there is coloring set "by measure" where I've changed default measure from Margin (value) to another (from Master Items) - Margin (percentage). It works, but the value is displayed without formatting: 0,0525 instead of 5,25%. I can't make that work.
Margin (percentage) is defined as =$(vMarginPerc) while this variable is set during loading script as follows:
LET vMarginPerc= 'num(sum([MarginValue])/sum([SaleValue]), ' & chr(39) & '# ##0,00%' & chr(39) & ')';
Wherever I'm displaying Margin (percentage) with formating set to "auto" it displayes correctly (f.e. KPI's, bar charts, etc) - only in Treemap as color by measure it doesn't want behave as I want...
Any ideas?
- Mark as New
- Bookmark
- Subscribe
- Mute
- Subscribe to RSS Feed
- Permalink
- Report Inappropriate Content
I am having the same issue. I am trying to display the number in percentage in the tooltip using color expression for a column chart but it is not working. Anyone with an idea?
- Mark as New
- Bookmark
- Subscribe
- Mute
- Subscribe to RSS Feed
- Permalink
- Report Inappropriate Content
hi
did you solve this? I have problem displaying percentage on the tooltip of a area layer (geoanalytics)
thanks ! any idea would be appreciated