Unlock a world of possibilities! Login now and discover the exclusive benefits awaiting you.

Announcements
Share your agentic AI experience, learn from others, and earn a new badge: Put Agentic AI to Work
- Qlik Community
- :
- Forums
- :
- Analytics & AI
- :
- Products & Topics
- :
- App Development
- :
- Trellis bar chart colours
Options
- Subscribe to RSS Feed
- Mark Topic as New
- Mark Topic as Read
- Float this Topic for Current User
- Bookmark
- Subscribe
- Mute
- Printer Friendly Page
Turn on suggestions
Auto-suggest helps you quickly narrow down your search results by suggesting possible matches as you type.
Showing results for

 danielnevitt
Creator
2023-06-27
03:17 PM
- Mark as New
- Bookmark
- Subscribe
- Mute
- Subscribe to RSS Feed
- Permalink
- Report Inappropriate Content
Trellis bar chart colours
Hi all,
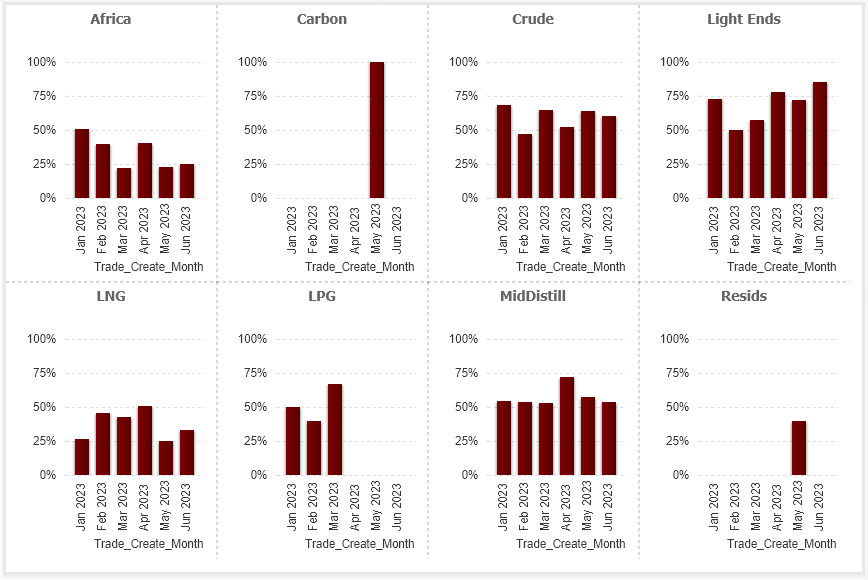
Is it possible to create a trellis bar graph where the bars are different colours based on an expression?
I have the attached graph and I would like to show the bars as green when they are 100% and red when they are below 100%.
I tried the following expression, however it doesn't work:
If(Count({<[Trader Review Status]={`Complete On Time`}>}trade_num)/Count(trade_num)>0.9,green(),If(Count({<[Trader Review Status]={`Complete On Time`}>}trade_num)/Count(trade_num)<0.9,red()))
Thanks,
Daniel
847 Views
0 Replies
