Unlock a world of possibilities! Login now and discover the exclusive benefits awaiting you.
- Qlik Community
- :
- Forums
- :
- Analytics & AI
- :
- Products & Topics
- :
- App Development
- :
- Re: Two Tables with dimensions in the same table
- Subscribe to RSS Feed
- Mark Topic as New
- Mark Topic as Read
- Float this Topic for Current User
- Bookmark
- Subscribe
- Mute
- Printer Friendly Page
- Mark as New
- Bookmark
- Subscribe
- Mute
- Subscribe to RSS Feed
- Permalink
- Report Inappropriate Content
Two Tables with dimensions in the same table
Hey,
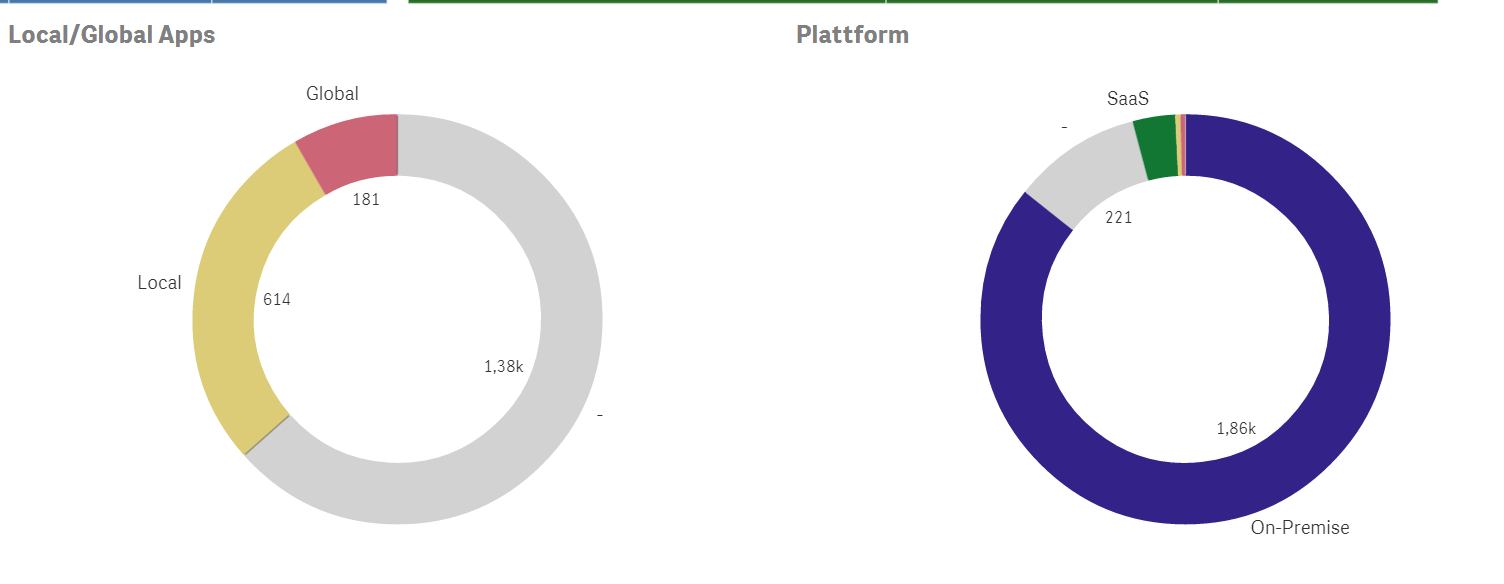
in my QlikSense app I have two pie charts which access the table "Tags". These tags have different topics, so I created multiple charts with tag dimensions. An object can have more than one tag in the data model.
My problem is, that when I select a filter in one of the two Tag-Pie-Charts, the other chart gets grey and says there are only objects with none of the other tags. I checked it in my data and there are objects that have two different tags. (Example screenshots are attached)
How can I archieve that the pie charts show the correct data, even though a "Tag" filter is selected?
- Mark as New
- Bookmark
- Subscribe
- Mute
- Subscribe to RSS Feed
- Permalink
- Report Inappropriate Content
Hi Lucas,
Can you share a sample qvf file.
- Mark as New
- Bookmark
- Subscribe
- Mute
- Subscribe to RSS Feed
- Permalink
- Report Inappropriate Content
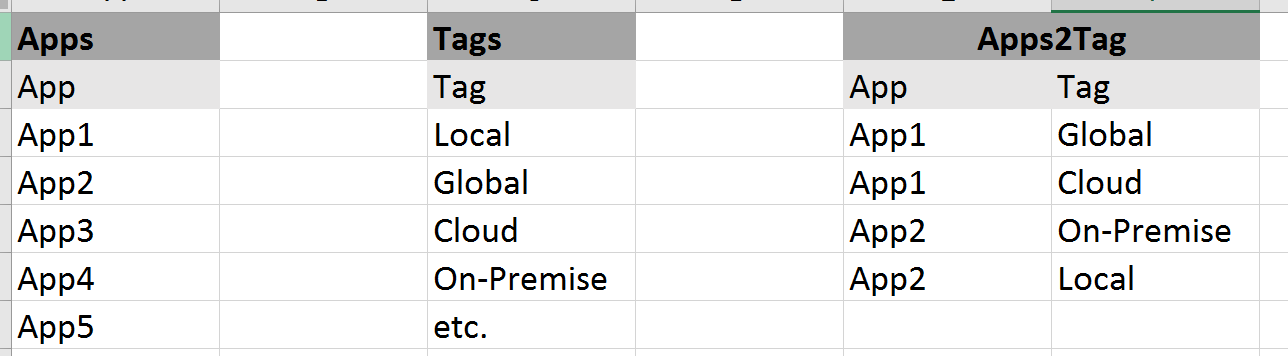
This is what the (relevant) data looks like. Is this what you are looking for?
- Mark as New
- Bookmark
- Subscribe
- Mute
- Subscribe to RSS Feed
- Permalink
- Report Inappropriate Content
Hi Lucas,
If i understand correctly what you want....
you could apply set analysis in the expression to ignore the 'Tags' field.
for example:
sum( {<[Tags]=>} UNITS)
Hope this helps
Dan
- Mark as New
- Bookmark
- Subscribe
- Mute
- Subscribe to RSS Feed
- Permalink
- Report Inappropriate Content
I used Count(AppName) to simply count all Objects.
Count({<[Tags]=>} AppName)
does not make Qliksense ignore other tag selections, the problems is still there.
Is my formula wrong?
- Mark as New
- Bookmark
- Subscribe
- Mute
- Subscribe to RSS Feed
- Permalink
- Report Inappropriate Content
Had a typo in it, works now..
Though that is not exactly what I wanted. The tag selection should not be ignored completely in the pie charts.
I want a set analysis to work normally (I choose a category in the one pie chart and the other adapts). I would really appreciate if you could help me with this.
- Mark as New
- Bookmark
- Subscribe
- Mute
- Subscribe to RSS Feed
- Permalink
- Report Inappropriate Content
Would be beneficial if you have a sample app to share so i can fully understand the context of what you need.